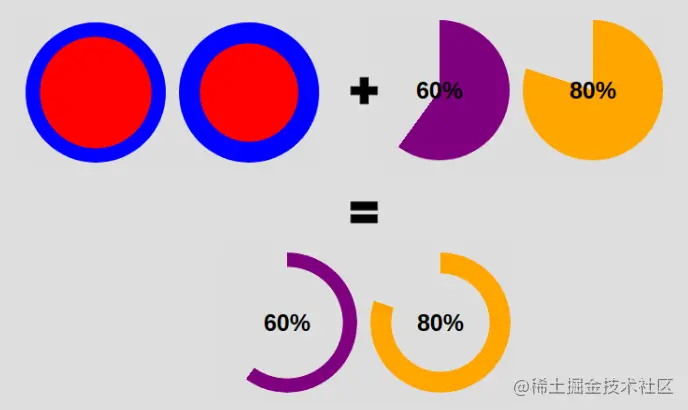
如何仅使用一个 DIV 配合 CSS 实现饼状图?下面本篇文章就来给大家看看实现方法,希望对大家有所帮助。

本文为译文「意译」
完整的代码请滑到文末。
我们只使用一个div,仅采用css实现饼状图。
<div class="pie" style="--p:60;--b:10px;--c:purple;">60%</div>
我们添加了几个 css 的变量:
--p:进度条的百分比(纯数字,不带%),饼状图值和 div 内容(带%)一致。--b:边框厚度的值--c:边框的主体颜色本文使用的是简写的变量,在生产环境中,为了达到可读性,我们应该使用--p -> --percentage, --b -> --border-thickness, --c -> --main-color 来表示。
我们为饼状图设定基本的样式。
.pie {
  --w: 150px; // --w -> --width
  width: var(--w);
  aspect-ratio: 1; // 纵横比,1 说明是正方形
  display: inline-grid;
  place-content: center;
  margin: 5px;
  font-size: 25px;
  font-weight: bold;
  font-family: sans-serif;
}上面我们使用了 aspect-ratio: 1; 保证 div 是正方形,当然你也可以使用 height: var(--w) 达到效果。
接下来,我们使用伪元素实现简单的饼状图:
.pie:before {
  content: "",
  position: absoute;
  border-radius: 50%;
  inset: 0; // 知识点 1
  background: conic-gradient(var(--c) calc(var(--p)*1%),#0000 0); // 知识点 2
}inset: 0; 相当于 top: 0; right: 0; bottom: 0; top: 0;conic-gradient 圆锥渐变,css 方法, 更多内容, 这里的 #0000 是 transparent 的十六进制。#0000 Hex Color · Red (0%) · Green (0%) · Blue (0%).
conic-gradient应用之后:
为了使得仅是边框的区域被看到,我们使用 mask 属性去隐藏中间圆的部分。我们将使用 radial-gradient() 方法:
radial-gradient(farthest-side,red calc(99% - var(--b)),blue calc(100% - var(--b)))
上面代码应用后,可得到效果图如下:
我们的目标如下图:

我们更改下代码即可实现:
<div class="pie" style="max-width:90%">60%</div>
.pie {
  --w:150px;

  width: var(--w);
  aspect-ratio: 1;
  position: relative;
  display: inline-grid;
  place-content: center;
  margin: 5px;
  font-size: 25px;
  font-weight: bold;
  font-family: sans-serif;
}
.pie:before {
  content: "";
  position: absolute;
  border-radius: 50%;
  inset: 0;
  background: conic-gradient(var(--c) calc(var(--p)*1%),#0000 0);
  -webkit-mask:radial-gradient(farthest-side,#0000 calc(99% - var(--b)),#000 calc(100% - var(--b)));
          mask:radial-gradient(farthest-side,#0000 calc(99% - var(--b)),#000 calc(100% - var(--b)));
}如何添加圆形边缘呢,看了下面插图,你就明白这个小技巧。
针对图上的效果(1),是将圆形放在开始的边缘。
.pie:before {
  background:
    radial-gradient(farthest-side, var(--c) 98%, #0000) top/var(--b) var(--b) no-repeat,
    conic-gradient(var(--c) calc(var(--p)*1%), #0000 0);
}针对图上的效果(2),是将圆形放在结束的边缘。
.pipe: after {
  content: "";
  position: absolute;
  border-radius: 50%;
  inset: calc(50% - var(--b)/2); // 知识点1
  background: var(--c);
  transform: rotate(calc(var(--p)*3.6deg)) translateY(calc(50% - var(--w)/2)); // 知识点2
}知识点1: 的 inset: 0; 上面我们也提到 -- 它是 left: 0; right: 0; bottom: 0; top: 0; 的简写。
这里我们有:
left = right = 50% - b/2
这里我们将元素往左和右移动了50% - b/2,也就等于元素宽度为 b, 且左右居中。针对高度,同理。
知识点2: 的旋转度数计算 --
angle = percentage * 360deg / 100
先将元素旋转了相应的度数,之后对其位置进行移动,这里涉及到了对 Y 轴居中。看文字也许有些难懂,结合下面的插图理解下:
到现在为止,我们实现的是一个静止的饼状图。我们接下来为它加上动效。
先注册变量:
@property --p {
syntax: '<number>';
inherits: true;
initial-value: 0;
}接着,我们创建关键帧:
@keyframes p {
  from {
    --p: 0
  }
}注意:这里我们只需要设置
from的--p值即可。浏览器会自动匹配我们预设to中的值(div class="pie" style="--p:60;">60%</div>)
最后,我们调用动画。
animation: p 1s .5s both;
嘿嘿~ 复制下面的代码体验一下吧。当然,我们也提供了 Gif 图(见文末)。
<div class="pie" style="--p:20"> 20%</div>
<div class="pie" style="--p:40;--c:darkblue;--b:10px"> 40%</div>
<div class="pie no-round" style="--p:60;--c:purple;--b:15px"> 60%</div>
<div class="pie animate no-round" style="--p:80;--c:orange;"> 80%</div>
<div class="pie animate" style="--p:90;--c:lightgreen"> 90%</div>
@property --p{
syntax: '<number>';
inherits: true;
initial-value: 1;
}
.pie {
--p:20;
--b:22px;
--c:darkred;
--w:150px;
width: var(--w);
aspect-ratio: 1;
position: relative;
display: inline-grid;
margin: 5px;
place-content: center;
font-size: 25px;
font-weight: bold;
font-family: sans-serif;
}
.pie:before,
.pie:after {
content: "";
position: absolute;
border-radius: 50%;
}
.pie:before {
inset: 0;
background:
radial-gradient(farthest-side,var(--c) 98%,#0000) top/var(--b) var(--b) no-repeat,
conic-gradient(var(--c) calc(var(--p)*1%),#0000 0);
-webkit-mask: radial-gradient(farthest-side,#0000 calc(99% - var(--b)),#000 calc(100% - var(--b)));
mask: radial-gradient(farthest-side,#0000 calc(99% - var(--b)),#000 calc(100% - var(--b)));
}
.pie:after {
inset: calc(50% - var(--b)/2);
background: var(--c);
transform: rotate(calc(var(--p)*3.6deg)) translateY(calc(50% - var(--w)/2));
}
.animate {
animation: p 1s .5s both;
}
.no-round:before {
background-size: 0 0, auto;
}
.no-round:after {
content: none;
}
@keyframes p{
from{--p:0}
}效果图:
原文 - How to Create a Pie Chart Using Only CSS
地址:https://www.freecodecamp.org/news/css-only-pie-chart/
遗憾的是,上面所用到的技术现存的浏览器不是很广泛地支持,你可以在Can I Use查找属性是否被相关版本浏览器支持。请你在谷歌内核的浏览器上面去尝试博文展示的效果。
PS:当然,如果你做内部系统的话,完全不用担心支持的问题,请规范你的团队对浏览器的使用。
【完】
(学习视频分享:css视频教程)
The above is the detailed content of Take you step by step to implement a pie chart using pure CSS. For more information, please follow other related articles on the PHP Chinese website!