
Pandas — Data processing
##Pyecharts — Data visualization
collections — Data statistics
Visualization part:
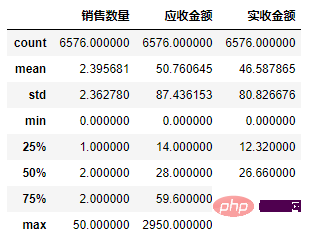
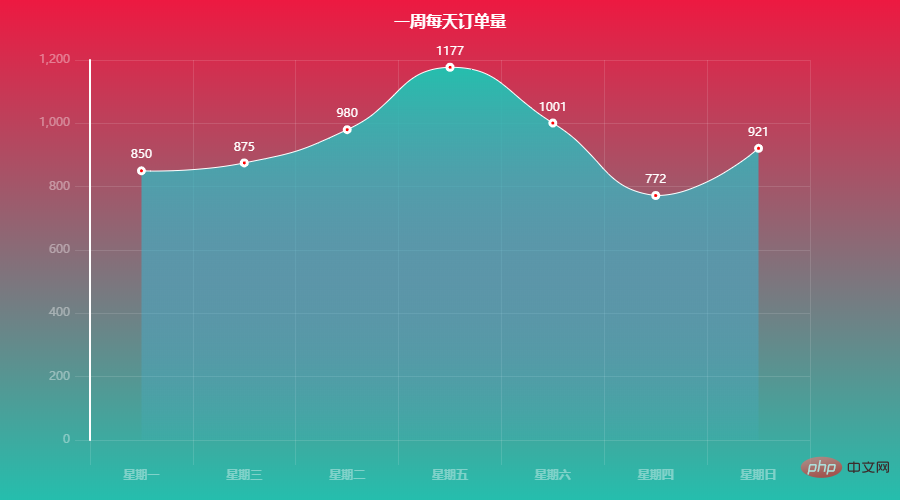
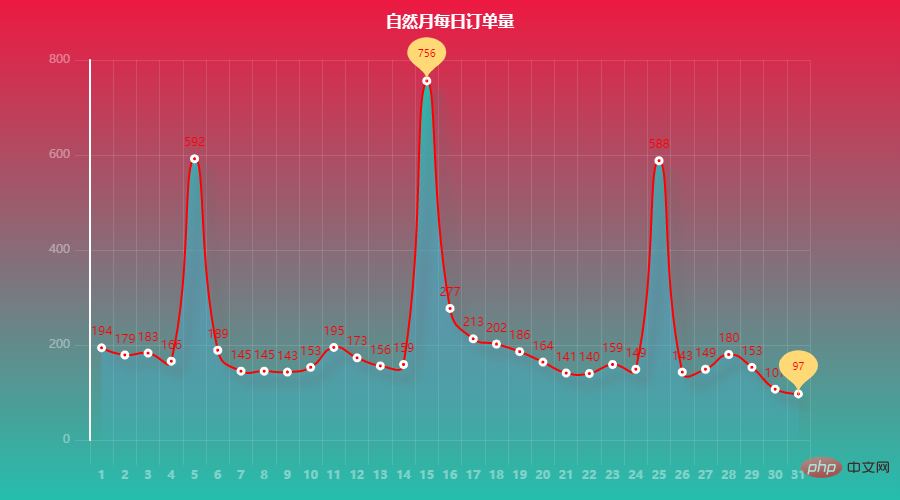
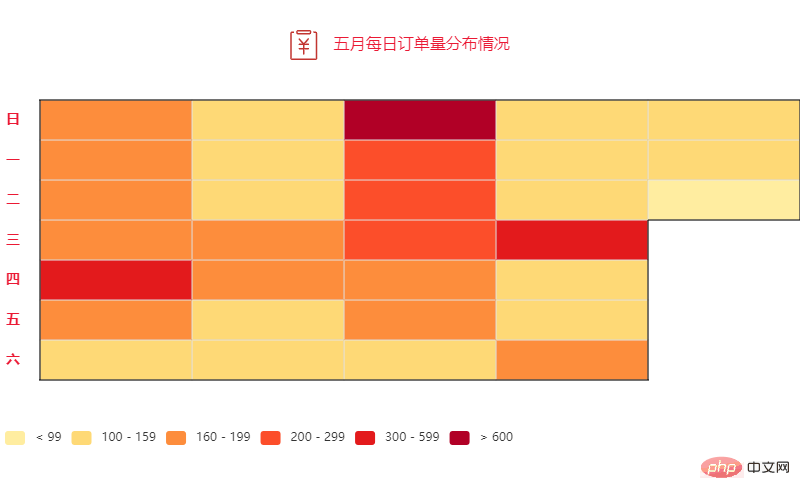
#2.1 Read Get data ## 6578 pieces of drug purchase data. 2.3 查看索引、数据类型和内存信息 2.4 统计空值数据 2.5 输出空行 2.6 销售数量,应收金额,实收金额三列的统计情况 2.7 列拆分(购药时间列拆分为两列) 代码: 每天销量整理相差不大,周五、周六偏于购药高峰。 代码: 可以看出:苯磺 酸氨氯地平片(安内真)、开博通、酒石酸美托洛尔片(倍他乐克)等治疗高血压、心绞痛药物购买量比较多。。
Due to space reasons, some codes are not fully displayed. If necessary, they can be obtained below, also Can be run online (including all code data files): https:/ /www.heywhale.com/mw/project/61b83bd9c63c620017c629bcimport jieba
import stylecloud
import pandas as pd
from PIL import Image
from collections import Counter
from pyecharts.charts import Geo
from pyecharts.charts import Bar
from pyecharts.charts import Line
from pyecharts.charts import Pie
from pyecharts.charts import Calendar
from pyecharts.charts import WordCloud
from pyecharts import options as opts
from pyecharts.commons.utils import JsCode
from pyecharts.globals import ThemeType,SymbolType,ChartType
df = pd.read_excel("医院药品销售数据.xlsx")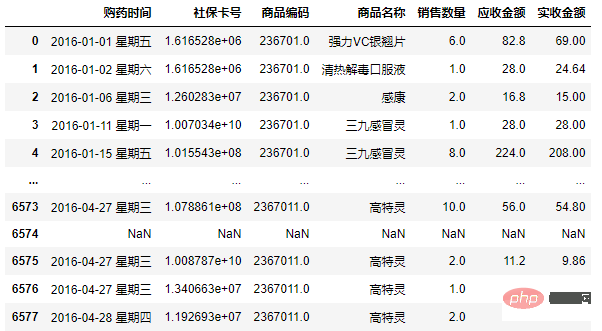
df.shape
(6578, 7)
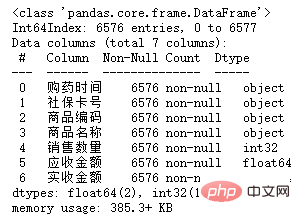
df.info()
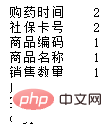
部分列存在数据缺失。
df.isnull().sum()
df[df.isnull().T.any()]

df1 = df.copy()
df1 = df1.dropna(subset=['购药时间'])
df1[df1.isnull().T.any()]
df1['社保卡号'].fillna('0000', inplace=True)
df1['社保卡号'] = df1['社保卡号'].astype(str)
df1['商品编码'] = df1['商品编码'].astype(str)
df1['销售数量'] = df1['销售数量'].astype(int)
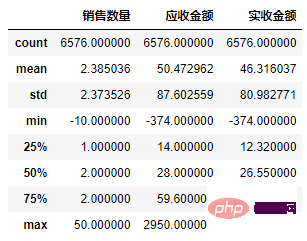
df1[['销售数量','应收金额','实收金额']].describe()
df2 = df1.copy()
df2['销售数量'] = df2['销售数量'].abs()
df2['应收金额'] = df2['应收金额'].abs()
df2['实收金额'] = df2['实收金额'].abs()
df3 = df2.copy()
df3[['购药日期', '星期']] = df3['购药时间'].str.split(' ', 2, expand = True)
df3 = df3[['购药日期', '星期','社保卡号','商品编码', '商品名称', '销售数量', '应收金额', '实收金额' ]]

color_js = """new echarts.graphic.LinearGradient(0, 1, 0, 0,
    [{offset: 0, color: '#FFFFFF'}, {offset: 1, color: '#ed1941'}], false)"""

g1 = df3.groupby('星期').sum()
x_data = list(g1.index)
y_data = g1['销售数量'].values.tolist()
b1 = (
        Bar()
        .add_xaxis(x_data)
        .add_yaxis('',y_data ,itemstyle_opts=opts.ItemStyleOpts(color=JsCode(color_js)))
        .set_global_opts(title_opts=opts.TitleOpts(title='一周各天药品销量',pos_top='2%',pos_left = 'center'),
            legend_opts=opts.LegendOpts(is_show=False),
            xaxis_opts=opts.AxisOpts(axislabel_opts=opts.LabelOpts(rotate=-15)),
            yaxis_opts=opts.AxisOpts(name="销量",name_location='middle',name_gap=50,name_textstyle_opts=opts.TextStyleOpts(font_size=16)))

    )
b1.render_notebook()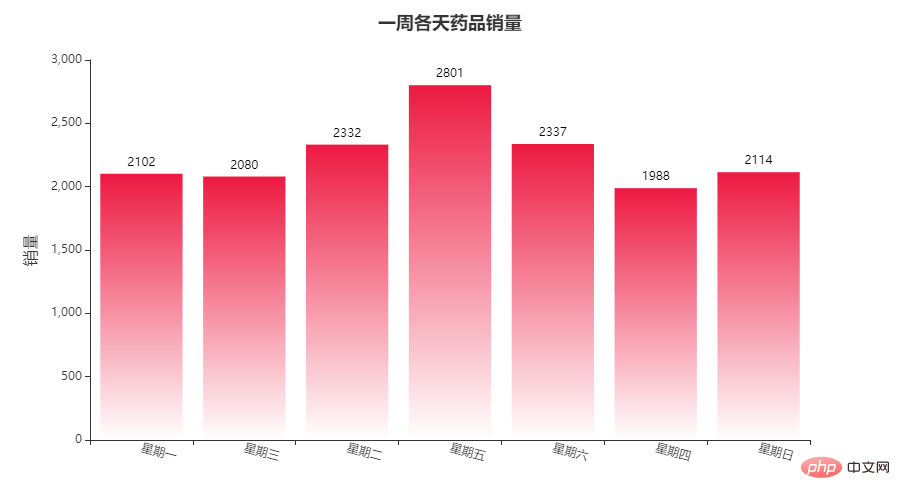
color_js = """new echarts.graphic.LinearGradient(0, 1, 0, 0,
    [{offset: 0, color: '#FFFFFF'}, {offset: 1, color: '#08519c'}], false)"""

g2 = df3.groupby('商品名称').sum().sort_values(by='销售数量', ascending=False)
x_data = list(g2.index)[:10]
y_data = g2['销售数量'].values.tolist()[:10]
b2 = (
        Bar()
        .add_xaxis(x_data)
        .add_yaxis('',y_data ,itemstyle_opts=opts.ItemStyleOpts(color=JsCode(color_js)))
        .set_global_opts(title_opts=opts.TitleOpts(title='药品销量前十',pos_top='2%',pos_left = 'center'),
            legend_opts=opts.LegendOpts(is_show=False),
            xaxis_opts=opts.AxisOpts(axislabel_opts=opts.LabelOpts(rotate=-15)),
            yaxis_opts=opts.AxisOpts(name="销量",name_location='middle',name_gap=50,name_textstyle_opts=opts.TextStyleOpts(font_size=16)))

    )
b2.render_notebook()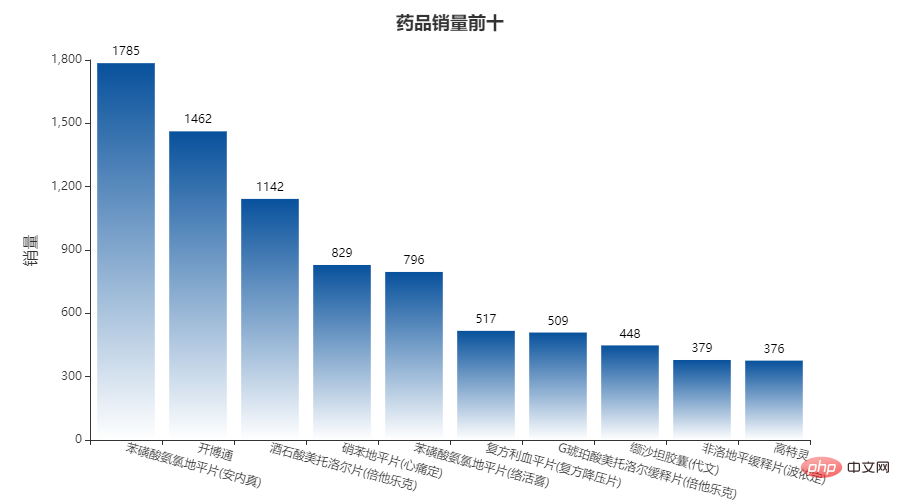
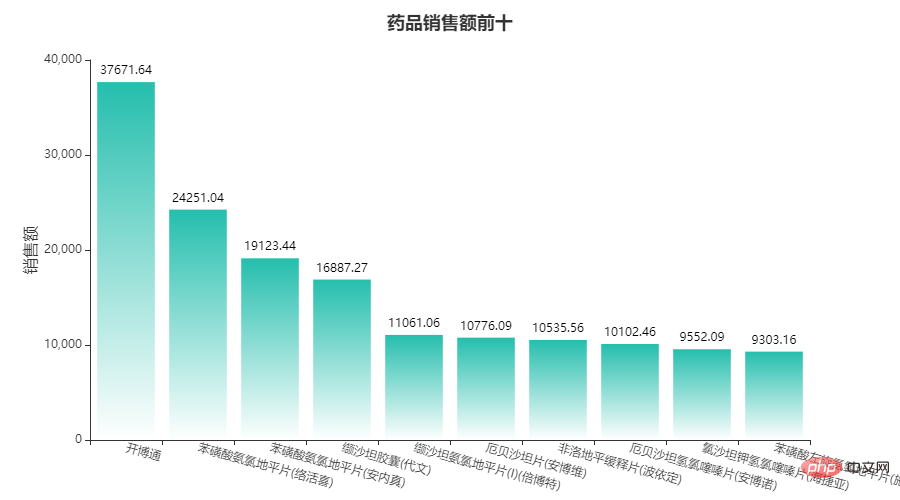
 ##3.6 Drug Name Word Cloud

The above is the detailed content of Pandas+Pyecharts | Hospital drug sales data visualization. For more information, please follow other related articles on the PHP Chinese website!


