Detailed explanation of how to debug Node.js in vscode

青灯夜游
Release: 2021-04-08 19:58:11
forward
6989 people have browsed it

This article will introduce to you how to debugNode.jsin vscode. It has certain reference value. Friends in need can refer to it. I hope it will be helpful to everyone.

Detailed explanation of how to debug Node.js in vscode

Recommended learning: "vscode tutorial", "nodejs tutorial"

Debug Node.js in vscode

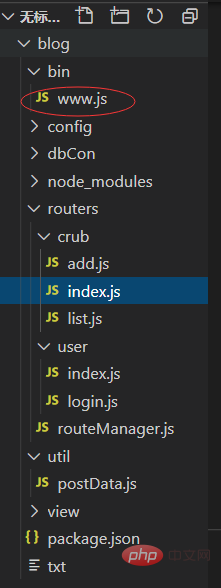
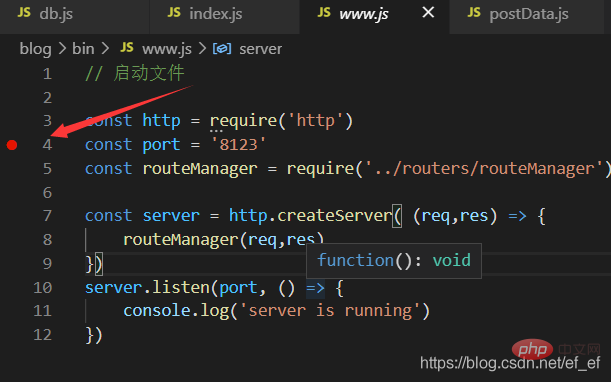
1. First remember which is the startup file

Detailed explanation of how to debug Node.js in vscode

2. Click this and then this
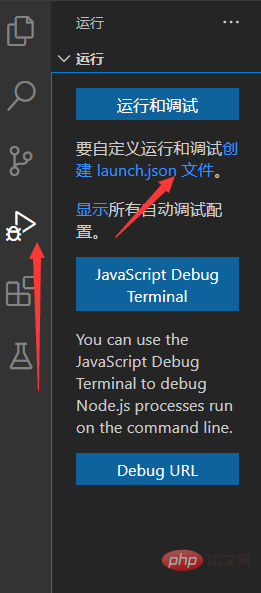
Detailed explanation of how to debug Node.js in vscode

3. Click on this

Detailed explanation of how to debug Node.js in vscode

4. Click on this

Detailed explanation of how to debug Node.js in vscode

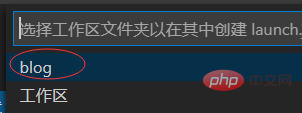
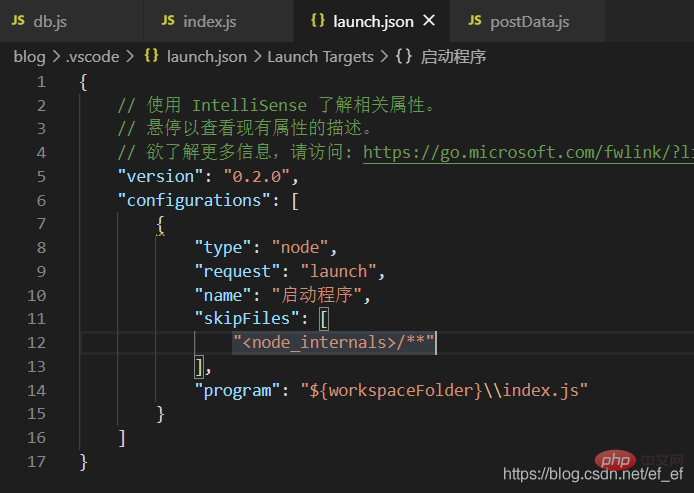
5. vscode will automatically create the debug configuration file of launch.json for you

The four attributes are the most important, type, request, name and program
type is the type of language. Such as PHP, Java, Node.js, etc.

request is the type of debug. There are two debug types in vscode, launch and attach. We only need to know the type of launch

name is the configuration name, used to distinguish different configurations

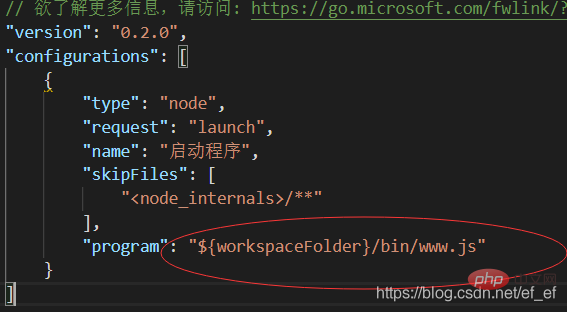
program is the startup file, our startup file is under ${workspaceFolder}/bin/www.js, so we need to change it

Detailed explanation of how to debug Node.js in vscode

6. Change it to this

Detailed explanation of how to debug Node.js in vscode

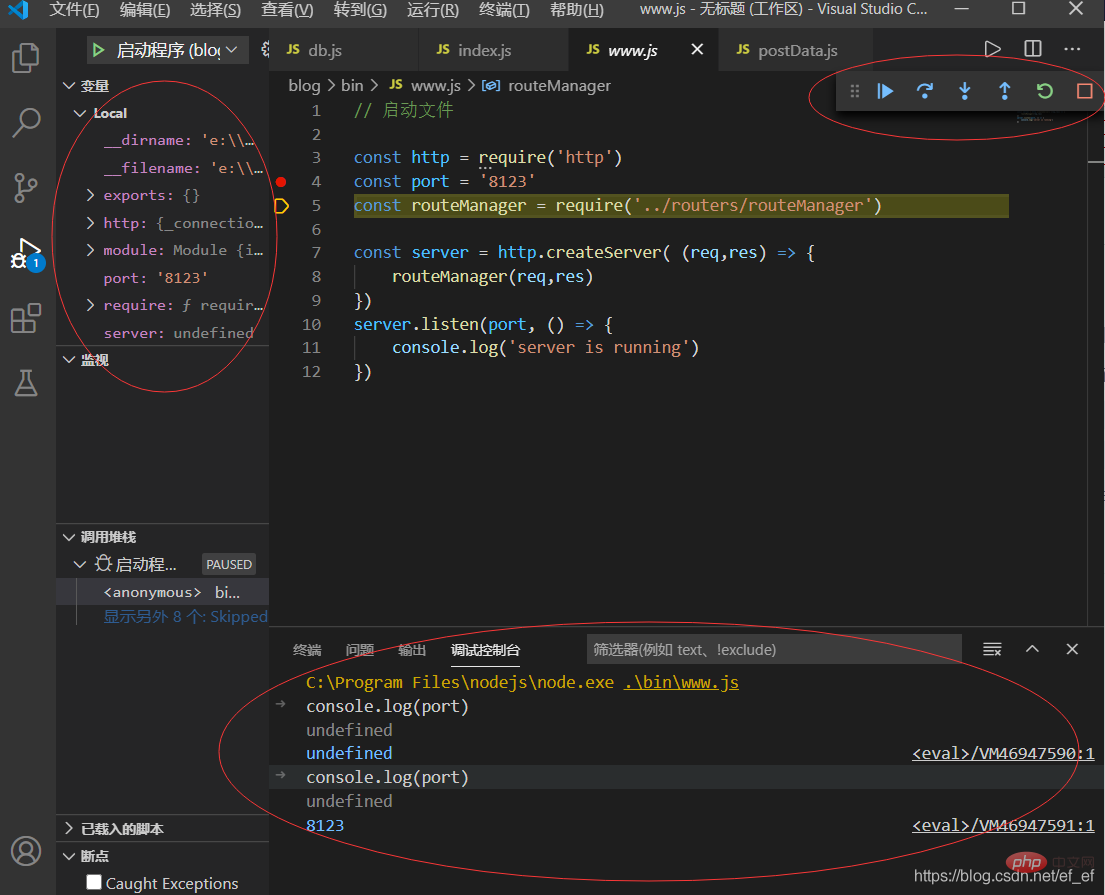
7. The breakpoint of this breakpoint

Detailed explanation of how to debug Node.js in vscode

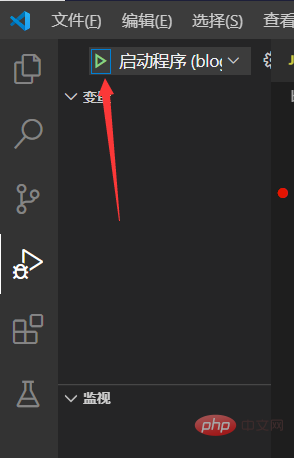
8. Click this to start debugging

Detailed explanation of how to debug Node.js in vscode

##9. On the left are variables, on the right are debug controllers, and below are the output and debugging consoles

debug controllers : The first one is to continue execution until the next breakpoint. The second one is single-step skipping, that is, continue to execute the next line of code (without jumping into the function). The third one is single-step debugging, that is, jump into the function and execute The first line of code of the function. The fourth is to single-step out, that is, execute the remaining part of the function and jump out of the function.

The bottom line of the debug controller can be console.log() or directly enter variables You can use the command named to view properties, and you can also execute code, such as assigning values to variables

Detailed explanation of how to debug Node.js in vscode

For more programming-related knowledge, please visit:

Programming Video! !

The above is the detailed content of Detailed explanation of how to debug Node.js in vscode. For more information, please follow other related articles on the PHP Chinese website!

Related labels:
source:csdn.net
Statement of this Website
The content of this article is voluntarily contributed by netizens, and the copyright belongs to the original author. This site does not assume corresponding legal responsibility. If you find any content suspected of plagiarism or infringement, please contact admin@php.cn
Latest Downloads
More>
Web Effects
Website Source Code
Website Materials
Front End Template
About us Disclaimer Sitemap
php.cn:Public welfare online PHP training,Help PHP learners grow quickly!