


How to debug js code in VSCode? The following article will introduce to you several methods of debugging js code in VSCode. It has certain reference value. Friends in need can refer to it. I hope it will be helpful to everyone.

Related recommendations: "vscode tutorial"
Introducing two methods of debugging js in VS Code:
Quokka.js plug-in
Debugger for Chrome with Live Server
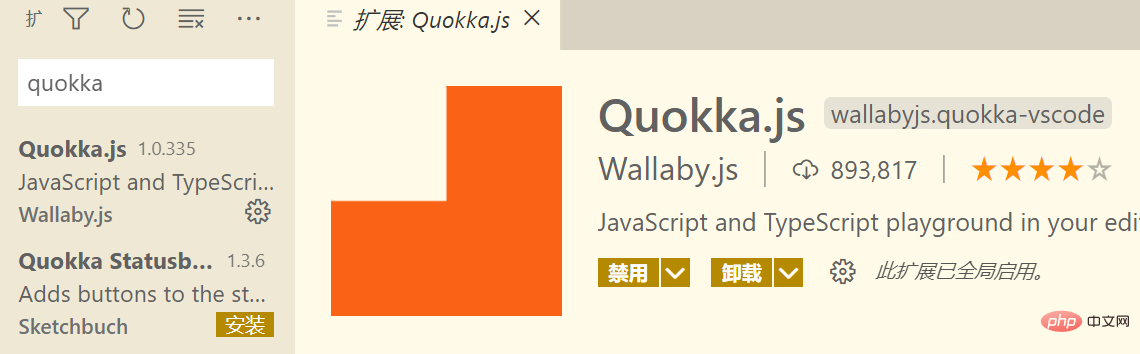
Quokka.js plug-in
Plug-in address: https://marketplace.visualstudio.com/items?itemName=WallabyJs.quokka-vscode
In the extension store Search and install:
Use the shortcut key ctrl shift P in VS code to bring up the panel and enter quo:
You can see that there are two options, one is to debug js and the other is to debug ts. We choose the first one.
There may be a prompt asking you whether to buy the pro version. You can turn it off and ignore it, or you can choose to buy it.
Try to enter a few lines of code in the open edit box:
You will find that the code runs in real time. The green square on the left represents that the statement was successfully executed. If the execution was unsuccessful, it will turn red.
Debugger for Chrome is paired with Live Server
Debugger for Chrome plug-in address: https:// marketplace.visualstudio.com/items?itemName=msjsdiag.debugger-for-chrome
Live Server plug-in address: https://marketplace.visualstudio.com/items?itemName=ritwickdey.LiveServer
Please download and install these two plug-ins first; this method requires the installation of Google Chrome.
Suppose you have such a front-end project:
After you install Live Server you will find VS Code There is a Go Live small button in the lower right corner:
Click it!
Live Srever will create a local development server and pop up a browser window with an address similar to this:
http://127.0.0.1:5500/
There will also be a prompt:
You can temporarily close this browser window, don’t worry, it won’t happen again. When you click the small button in the lower right corner or close VS Code, you can still open the web page just now through http://127.0.0.1:5500/.
Please remember this port number: 5500, because it will be used later. When you open Live Server or other programs that occupy this port number, the port number will automatically be 1.
As the name suggests, Live Server is updated in real time. When you modify the project files or code, Live Server will update immediately and automatically refresh the page.
Return to the editor.
Click in turn: Run icon-> Create launch.json file:
Overwrite the original configuration with the following configuration and save:
{
    // 使用 IntelliSense 了解相关属性。
    // 悬停以查看现有属性的描述。
    // 欲了解更多信息,请访问: https://go.microsoft.com/fwlink/?linkid=830387
    "version": "0.2.0",
    "configurations": [
        {
            "type": "chrome",
            "request": "launch",
            "name": "chrome 调试",
            "url": "http://localhost:5500",
            "webRoot": "${workspaceFolder}"
        }
    ]
}VS Code will save the relevant configuration in the directory where the project is located:
Note: "url" The port number 5500 in the field must correspond to the port number provided by Live Server.
Click:
You will see:
As you wish, it has It's working normally.
We move the mouse to the icon position and click to set a breakpoint:
Then click the button on the web page:
你会看到打上的断点成功拦截执行:
细心的你可能会发现,当点击一次 Go Live 按钮时会打开一个浏览器窗口,再点击一次调试按钮时(快捷键 F5),会打开第二个用于调试的窗口。这可能是没有必要的,我们只需要一个窗口就行了。
下面我们来编辑配置,使这个过程只需打开一次浏览器窗口。
点击 “chrome 调试” 旁边的齿轮:
在打开的编辑框依次点击:
得到如下配置并保存:
在扩展商店搜索 Live Server 并打开它的扩展设置:
需要修改的配置有两个:
1、Chrome Debugging Attachment
点击进入,将 "liveServer.settings.ChromeDebuggingAttachment": false 改为 true。
"liveServer.settings.ChromeDebuggingAttachment": true
2、Custom Browser
点击此选项中的下拉框,我们选择 chrome:

修改完成!
接下来我们重启 Live Srever 服务:
回到 VS Code,按下 F5 键,启动调试:
之后本项目的每次调试你只需要点击 Go Live 按钮并回到 VS Code 按下 F5 键就行了。
当然,chrome 调试 选项可能还是生效的,当你关掉 Live Server 打开的浏览器窗口时,可以尝试使用这个选项再次打开。
如果遇到端口号被占用的情况,可以点击调试旁边的齿轮来修改。
祝:
永无 BUG!
使用到的代码:
<!-- ./index.html -->
<!DOCTYPE html>
<html>
<head>
    <meta charset="UTF-8">
    <meta name="viewport" content="width=device-width, initial-scale=1.0">
    <title>Document</title>
</head>
<body>
    <div id="time">请点击下方按钮以获取当前时间</div>
    <button id="getTime">获取时间</button>
    <script src="./js/index.js"></script>
</body>
</html>// ./js/index.js
let getTimeBtn = document.getElementById("getTime");
getTimeBtn.onclick = function (e) {
let time = document.getElementById("time");
let now = new Date().toLocaleString();
time.innerHTML = now;
}// ./.vscode/launch.json
{
// 使用 IntelliSense 了解相关属性。
// 悬停以查看现有属性的描述。
// 欲了解更多信息,请访问: https://go.microsoft.com/fwlink/?linkid=830387
"version": "0.2.0",
"configurations": [
{
"name": "Attach to Chrome",
"port": 9222,
"request": "attach",
"type": "pwa-chrome",
"webRoot": "${workspaceFolder}"
},
{
"type": "chrome",
"request": "launch",
"name": "chrome 调试",
"url": "http://localhost:5500",
"webRoot": "${workspaceFolder}"
}
]
}更多编程相关知识,请访问:编程课程!!
The above is the detailed content of A brief discussion on several methods of debugging js code in VSCode. For more information, please follow other related articles on the PHP Chinese website!


![[Web front-end] Node.js quick start](https://img.php.cn/upload/course/000/000/067/662b5d34ba7c0227.png)


