Found a total of 10000 related content
PHP兑现动态生成饼状图、柱状图和折线图(转)
Article Introduction:
PHP实现动态生成饼状图、柱状图和折线图(转)
PHP在图像操作方面的表现非常出色,我们只需借助可以免费得到的GD库便可以轻松实现图、表勾画。下面将分别介绍PHP实现的饼状图、折线图和柱状图以及他们的使用方法,这几段代码的特点就是不需要再把它们复制到你的代码之中,只需要把计算得到的数据作为参数传入,即可得到相应的图形效果代码中所有使用的函数的说明
2016-06-13
comment 0
1266

Solving practical problems: A practical guide to Matplotlib line charts
Article Introduction:Practical Guide: Using matplotlib to draw line charts to solve practical problems Introduction Data visualization plays an important role in solving practical problems. The line chart is the most commonly used and common chart type. In this article, we will introduce how to use Python's matplotlib library to draw a line chart, and solve practical problems through specific code examples. 1. Preparation Before starting, we need to install the matplotlib library. Open a terminal or command prompt and enter the following command to install
2024-01-17
comment 0
1203

Practical Excel skills sharing: 5 small steps to help you create a high-quality line chart
Article Introduction:Line charts are a very common way of displaying data in our daily data visualization, and I think everyone is already familiar with it. Line charts are very simple and everyone can make them, but the line charts produced by different people vary widely. Most people's line charts are generated by directly inserting the default line chart style. Regardless of whether they have made such a line chart carefully, the boss is tired of looking at it just because of this style. Today, this article will teach you how to make a high-quality line chart. Let’s take a look!
2023-04-12
comment 0
6842

Learn more about matplotlib: Discover the advanced functions and practical applications of drawing line charts
Article Introduction:Advanced tutorial: Explore more functions and applications of matplotlib for drawing line charts. Line charts are a commonly used chart type in data visualization. They can clearly show the changing trends and relationships of data. Matplotlib is one of the most commonly used data visualization libraries in Python, which is powerful and easy to use. This article will introduce how to use matplotlib to draw a line chart, and further explore its more functions and applications. Introducing the basic usage of matplotlib. To start drawing a line chart, first
2024-01-17
comment 0
1135

How to implement automatically updated real-time statistical charts in PHP and Vue.js
Article Introduction:How to implement automatically updated real-time statistical charts in PHP and Vue.js Preface: Real-time statistical charts are one of the very important features for many websites and applications. During development, PHP and Vue.js are one of the two widely used tools. This article will introduce how to combine PHP and Vue.js to realize the function of automatically updating real-time statistical charts. Step 1: Set up the environment First, make sure you have PHP and Vue.js installed and set up a basic development environment
2023-08-18
comment 0
970

Use EVAL to process jqchart jquery line chart return data invalid solution_jquery
Article Introduction:The eval function can parse some processed program code to reach a state that can be executed. This article will introduce to you the solution to using eval to process the invalid data returned by jqchart jquery line chart. Friends who are interested in jqchart jquery related content will learn together. Bar
2016-05-16
comment 0
1175

Learn the basic steps to draw a line chart with matplotlib
Article Introduction:Matplotlib is one of the most famous and commonly used data visualization libraries in Python. Mastering the basic steps of drawing line charts with Matplotlib is very important for data analysis work. This article will start from scratch, introduce the basic steps of drawing a line chart with Matplotlib for beginners, and provide specific code examples. Importing the matplotlib library To start drawing graphics with Matplotlib, you first need to import the Matplotlib library. It can be imported using the following code: im
2024-01-17
comment 0
1247

What are the methods of data visualization?
Article Introduction:Data visualization methods include static charts, dynamic charts, geographical visualization, 3D visualization, interactive visualization, text visualization and big data visualization, etc. Detailed introduction: 1. Static charts are one of the most common data visualization methods. By using various chart libraries, we can create various static charts, such as line charts, bar charts, pie charts, etc.; 2. Dynamic charts can be used in time Changes in the data are shown on the axis. By using JavaScript libraries, we can create various dynamic charts, such as line charts that update in real time, dynamic maps, and more.
2023-08-22
comment 0
7419

Example of echarts setting polyline line color and polyline point color
Article Introduction:This article mainly introduces the method of jQuery plug-in echarts to set the color of polyline lines and polyline points in the line chart. It also analyzes the related operation skills of jQuery plug-in echarts to set the line chart in the form of examples. Friends who need it can refer to it. I hope it can help everyone. .
2018-05-18
comment 0
11794

How to draw a line chart based on tabular data How to draw a line chart based on tabular data
Article Introduction:Sometimes we draw bar charts, line charts, Gantt charts, pie charts and other graphics in Excel tables to better show changes in data. But there are still many friends who don’t know how to draw it. In this tutorial, the editor will show you how to make a line chart from Excel table data. If you are interested, don’t miss it! Operation method 1. Open the Excel data table. 2. Select all table contents, and then click Insert - Line Chart on the menu bar. 3. Select a line chart you like and click on it. 4. Then, a line chart with consistent data will be automatically generated in the Excel table.
2024-08-27
comment 0
904


How to add high and low point connecting lines to PPT line chart
Article Introduction:How to add high and low point connecting lines to PPT line chart? Recently, a user asked this question. In daily study and office work, sometimes you need to make a PPT line chart. When making it, you want to add high and low points connecting lines. How should you do it? In response to this problem, this article brings a detailed introduction to the method and shares it with everyone. Let’s take a look. Method for adding high and low point connections to a PPT line chart: 1. Open PPT and create a blank document. 2. Click [Insert]-[Chart]-[Line Chart]. 3. Click [OK] to get the default style line chart. 4. Enter the data to make the line chart in the Excel table. At least two columns of data are required, and then the line will be automatically generated as the data changes. 5. Close
2024-08-29
comment 0
684

How to add high and low point connecting lines to PPT line chart
Article Introduction:How to add high and low point connecting lines to PPT line chart? Recently, a user asked this question. In daily study and office work, sometimes you need to make a PPT line chart. When making it, you want to add high and low points connecting lines. How should you do it? In response to this problem, this article brings a detailed introduction to the method and shares it with everyone. Let’s take a look. Method for adding high and low point connections to a PPT line chart: 1. Open PPT and create a blank document. 2. Click [Insert]-[Chart]-[Line Chart]. 3. Click [OK] to get the default style line chart. 4. Enter the data to make the line chart in the Excel table. At least two columns of data are required, and then the line will be automatically generated as the data changes. 5. Close
2024-08-29
comment 0
546

How to use excel to make a line chart - How to use excel to make a line chart
Article Introduction:Many friends don’t know how to use Excel to make a line chart, so the editor below will share how to use Excel to make a line chart. Let’s take a look. I believe it will be helpful to everyone. 1. Open the Excel data table (as shown in the figure below). 2. Select all the table contents, and then click Insert - Line Chart in the menu bar (as shown in the figure below). 3. Select a line chart you like and click on it (as shown in the picture below). 4. Finally, a line chart with consistent data will be automatically generated in the Excel table (as shown in the figure below). The above is the entire content of how to use Excel to make a line chart brought to you by the editor. I hope it can be helpful to you.
2024-03-04
comment 0
1593

How to make a line chart in WPS How to make a line chart in WPS
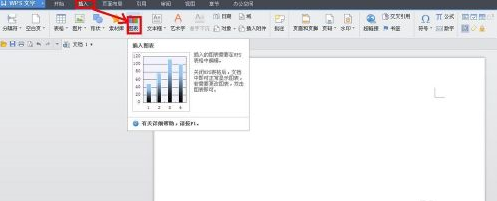
Article Introduction:Many users are using WPS software in their offices, but do you know how to create a line chart with WPS? Next, the editor will bring you the method of making a line chart with WPS. Users who are interested in this can take a look below. How to create a line chart in WPS? How to make a line chart with WPS Open the WPS text software, click "Insert" - Chart in the menu bar, as shown in the figure. At this time, a histogram will appear in the WPS text software, and the WPS table software will automatically open, and a histogram will also be generated in the WPS table. In the WPS spreadsheet software, click the column chart just inserted to make it selected, and then click "Insert" - Chart in the menu bar. The "Chart Type" dialog box pops up. Find "Collapse" in the list box.
2024-08-13
comment 0
642

Learn to draw line charts, bar charts and pie charts with Python in three minutes
Article Introduction:Learn to draw line charts, bar charts, and pie charts with Python in three minutes. Python is a very popular programming language that is widely used in data analysis and visualization. In this article, we will learn how to draw three common types of charts using Python: line charts, bar charts, and pie charts. I'll provide you with specific code examples to help you get started quickly. Line Chart A line chart is a type of chart that shows trend changes by connecting data points. In Python, we can use the matplotlib library to plot
2023-09-27
comment 0
1333

How to make a line chart in ppt
Article Introduction:When we demonstrate PPT, we often have comparative analysis of some data types. In order to make the comparative analysis more intuitive, we often need to add chart styles for display. Pie charts, bar charts, line charts, etc. can be inserted as needed. Here we share how to insert one of the charts and learn how to insert the line chart. The operation of the other charts will be similar. 1. First turn on the computer and open ppt. We create a new blank presentation and click insert. 2. Then click on the chart and we can see many chart options. As shown in the figure below: 3. We are trying to insert a line chart, so we click to select the line chart. 4. There are many options for line charts. We will choose the first simple and basic line chart, and then click
2024-03-20
comment 0
925

In-depth study of Matplotlib drawing: example analysis and skill sharing
Article Introduction:Play with Matplotlib drawing methods: detailed examples and skill sharing Matplotlib is a powerful Python drawing library that can be used to generate various static, dynamic, and interactive data visualization charts. This article will introduce you to several commonly used Matplotlib drawing methods, and share some examples and techniques. Line chart A line chart is one of the most common chart types in Matplotlib and can be used to present trends in data over time. Here is a simple line chart drawing example: i
2024-01-13
comment 0
1036


