
本期为<知乎热榜/微博热搜时序图>系列文章下篇 Content, [Part 1] introduces you how to use Python to regularly crawl Zhihu hot list/Weibo hot search data. Today will introduce to you how to use pyecharts to create a time series chart of hot list data. (Dynamic carousel chart) , I hope it will be helpful to you.
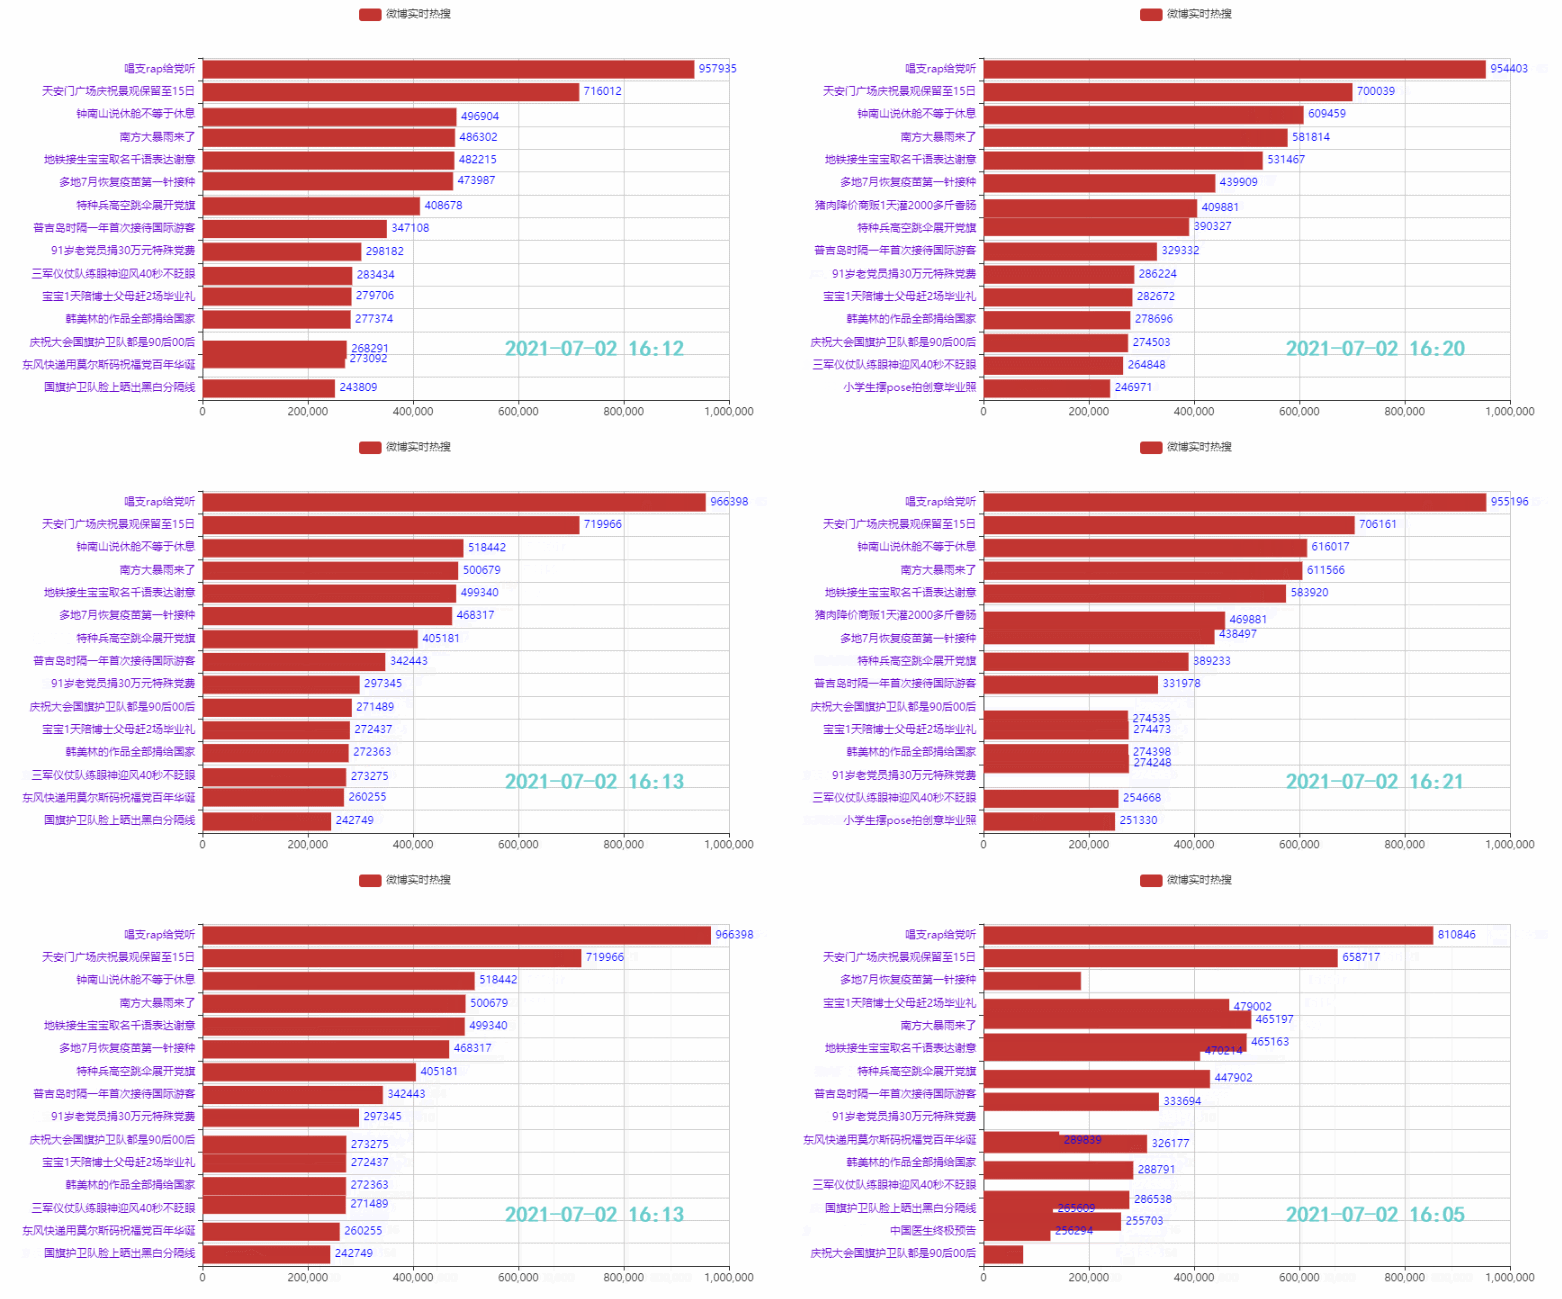
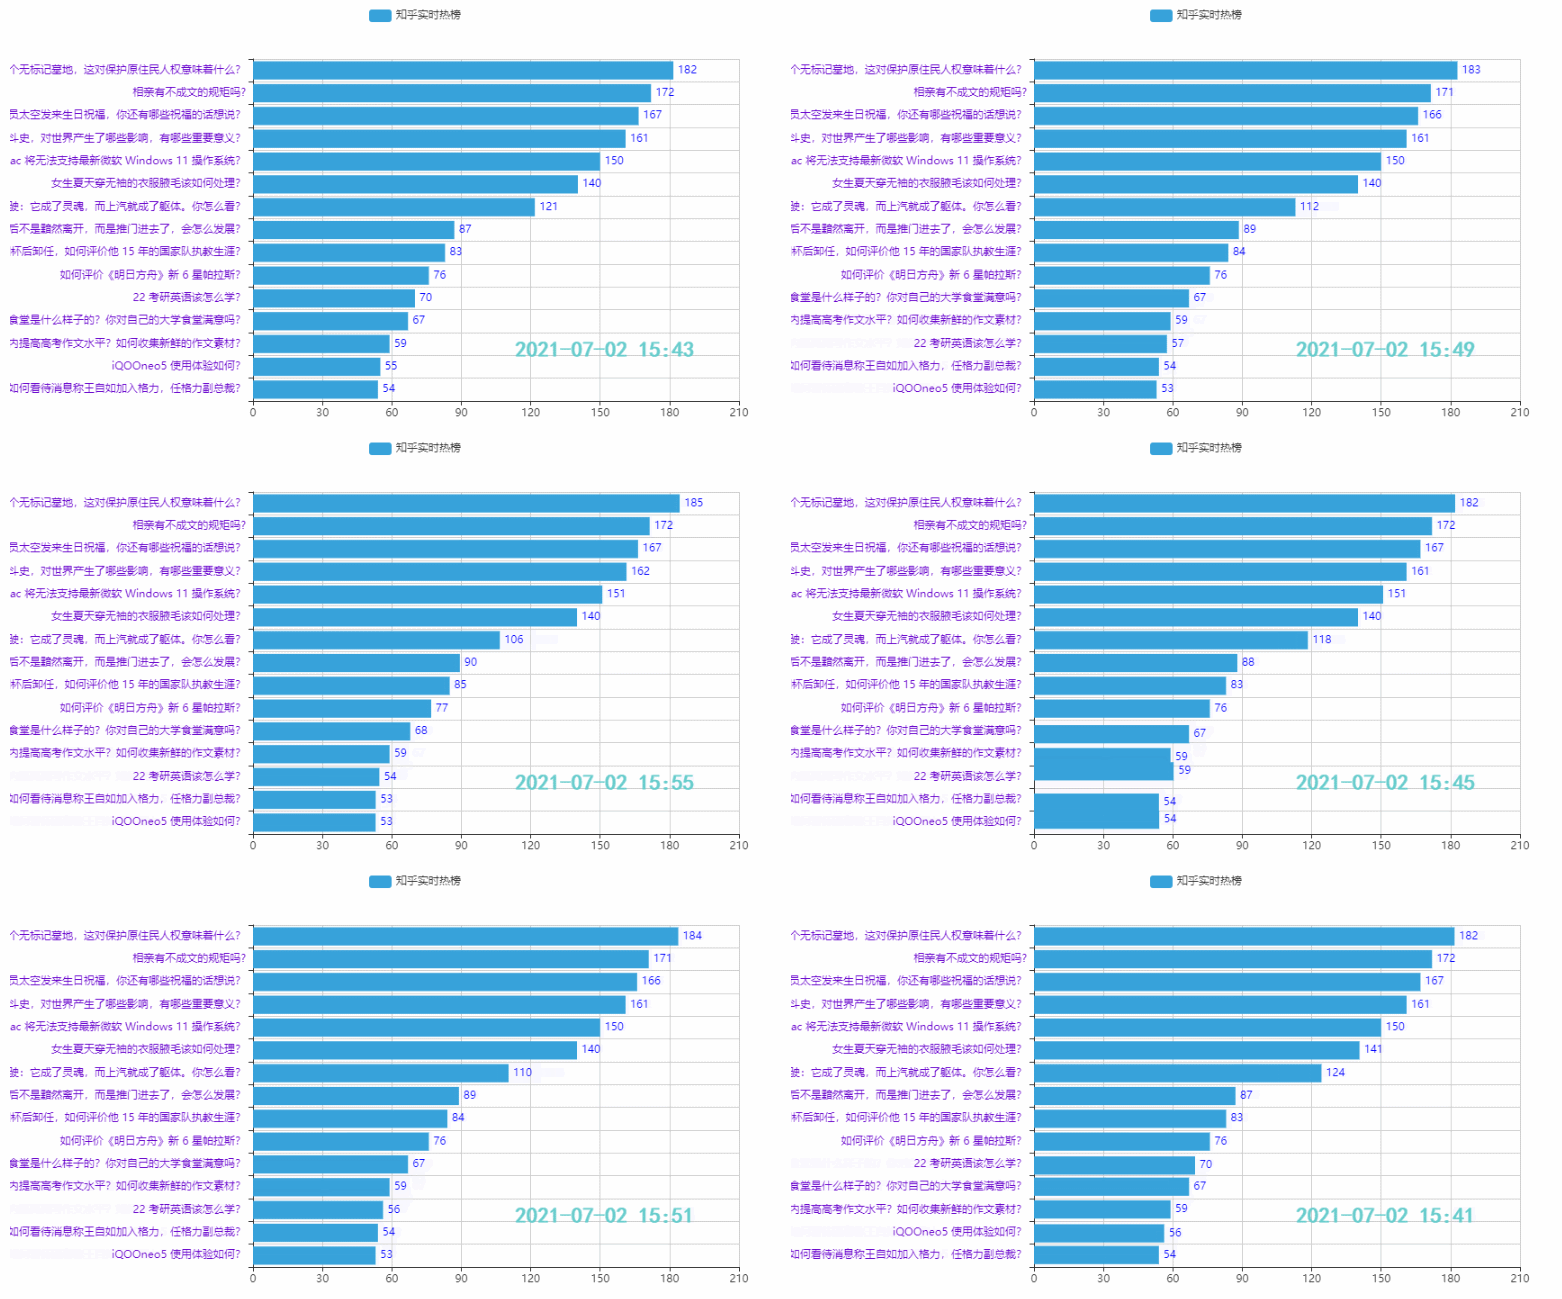
Let’s take a look at the effect first (different playback speeds):
names = ['詹姆斯', '杜兰特', '库里', '欧文', '哈登']
allinfo = [[[492, 610, 533, 416, 565, 639, 709, 465, 472], [387, 551, 488, 511, 514, 646, 747, 454, 636], [1683, 2036, 2089, 1743, 1920, 1954, 2251, 1505, 1544]], [[533, 527, 640, 598, 178, 589, 513, 464, 497], [214, 231, 374, 445, 110, 361, 300, 366, 457], [2161, 1850, 2280, 2593, 686, 2029, 1555, 1792, 2027]], [[88, 314, 334, 341, 430, 353, 261, 369, 26], [138, 539, 666, 619, 527, 524, 310, 361, 33], [383, 1786, 1873, 1900, 2375, 1999, 1346, 1881, 104]], [[191, 216, 259, 237, 157, 230, 227, 335, 103], [275, 350, 433, 389, 250, 418, 306, 464, 128], [944, 1325, 1478, 1628, 1041, 1816, 1466, 1596, 548]], [[252, 379, 344, 459, 501, 659, 389, 518, 387], [229, 455, 446, 565, 612, 907, 630, 586, 450], [1044, 2023, 1851, 2217, 2376, 2356, 2191, 2818, 2096]]]
The data comes from a previous article:
["James" ranks first in NBA official jersey sales list , quickly see where your idol ranks 】
时序图代码:
y1 = []
y2 = []
y3 = []
for i in range(9):
    y_trb_sorce = []
    y_ast_sorce = []
    y_pts_sorce = []
    for j in range(5):
        y_trb_sorce.append(allinfo[j][0][i])
        y_ast_sorce.append(allinfo[j][1][i])
        y_pts_sorce.append(allinfo[j][2][i])
    y1.append(y_pts_sorce)
    y2.append(y_ast_sorce)
    y3.append(y_trb_sorce)

years = ['11-12赛季', '12-13赛季', '13-14赛季', '14-15赛季', '15-16赛季', '16-17赛季', '17-18赛季', '18-19赛季', '19-20赛季']
tl = Timeline()
for i in range(9):
    bar = (
        Bar()
            .add_xaxis(names)
            .add_yaxis('得分', y1[i])
            .add_yaxis('助攻', y2[i])
            .add_yaxis('篮板', y3[i])
            .set_global_opts(title_opts=opts.TitleOpts("{}三项数据".format(years[i])))
    )
    tl.add(bar, "{}".format(years[i]))
tl.render_notebook()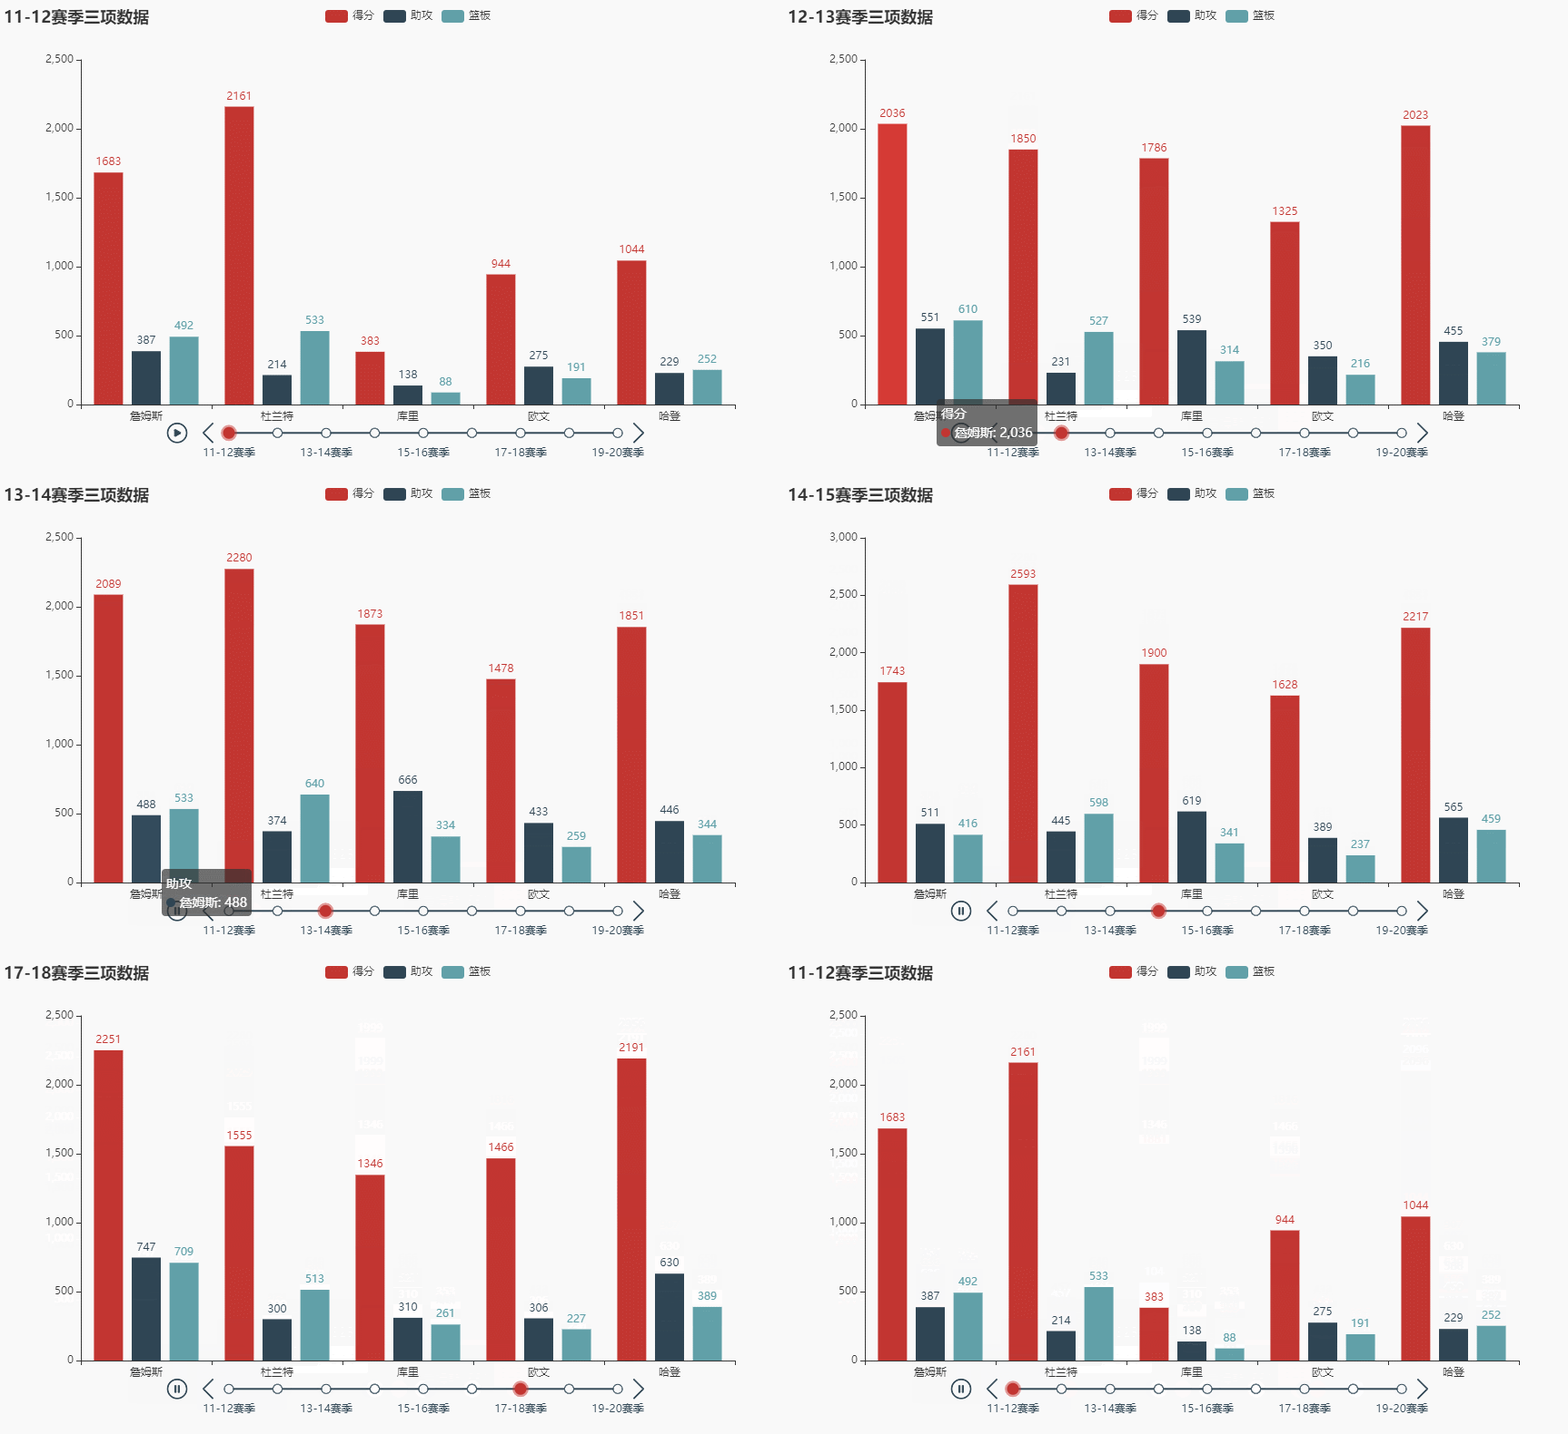
2.1 Reading data
weibo_data = pd.read_csv('weibo_hot_datas.csv')
weibo_data.head()
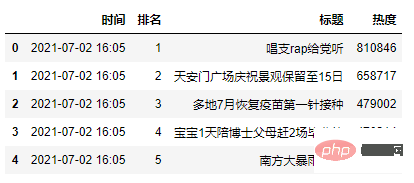
2.2 排名前15的热点
代码:
tl = Timeline()
count = 50
time_data_counts = int(weibo_data.shape[0]/count)
times = weibo_data['时间'].values.tolist()
for i in range(time_data_counts):
    bar = (
        Bar()
            .add_xaxis(list(weibo_data['标题'])[i*count:i*count+15][::-1])
            .add_yaxis('微博热搜', list(weibo_data['热度'])[i*count:i*count+15][::-1])
            .reversal_axis()
            .set_global_opts(title_opts=opts.TitleOpts('{}'.format(times[i*count])))
    )
    tl.add(bar, "{}".format(times[i*count]))
tl.render_notebook()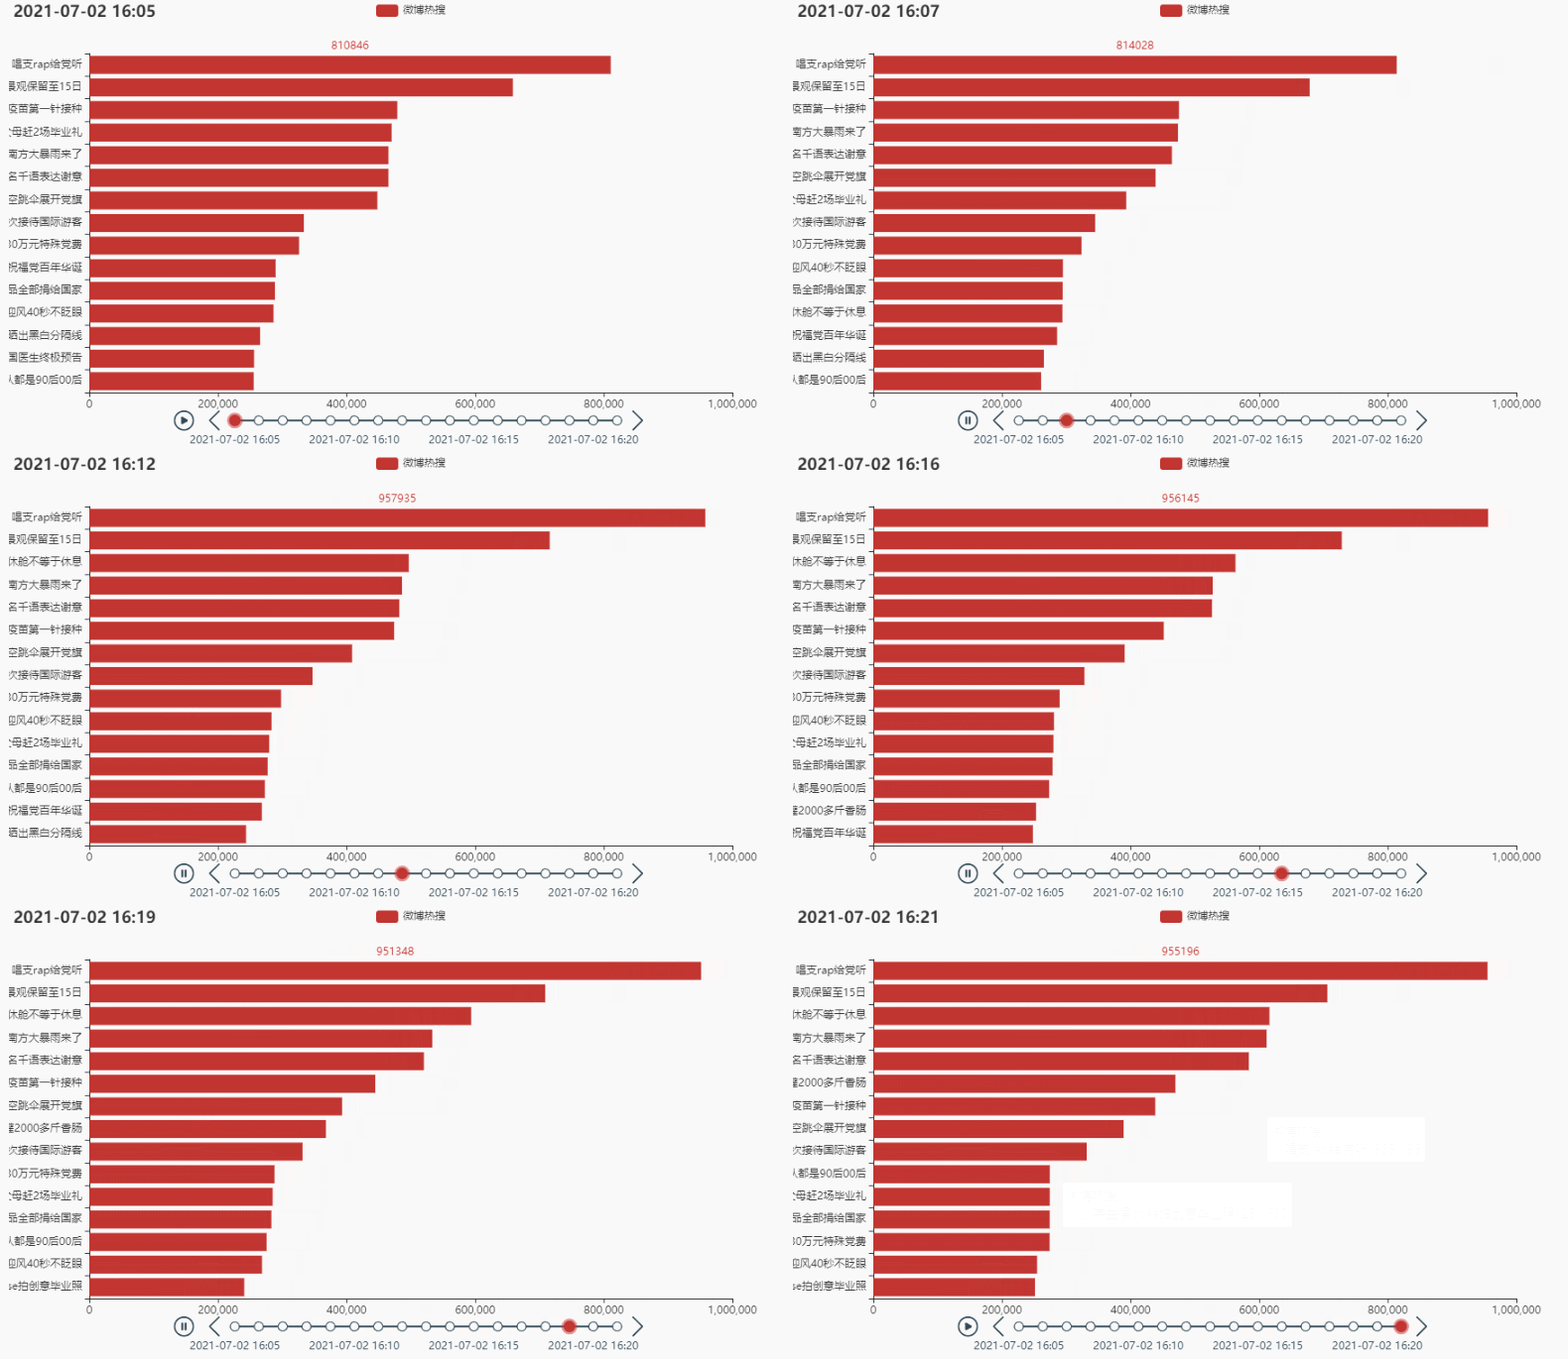
2.3 调整边距
代码:
# 将图形整体右移
grid = (
    Grid()
    .add(bar, grid_opts=opts.GridOpts(pos_left='30%', pos_right='10%'))
)
tl.add(bar, "{}".format(times[i*count]))
tl.add(grid, '')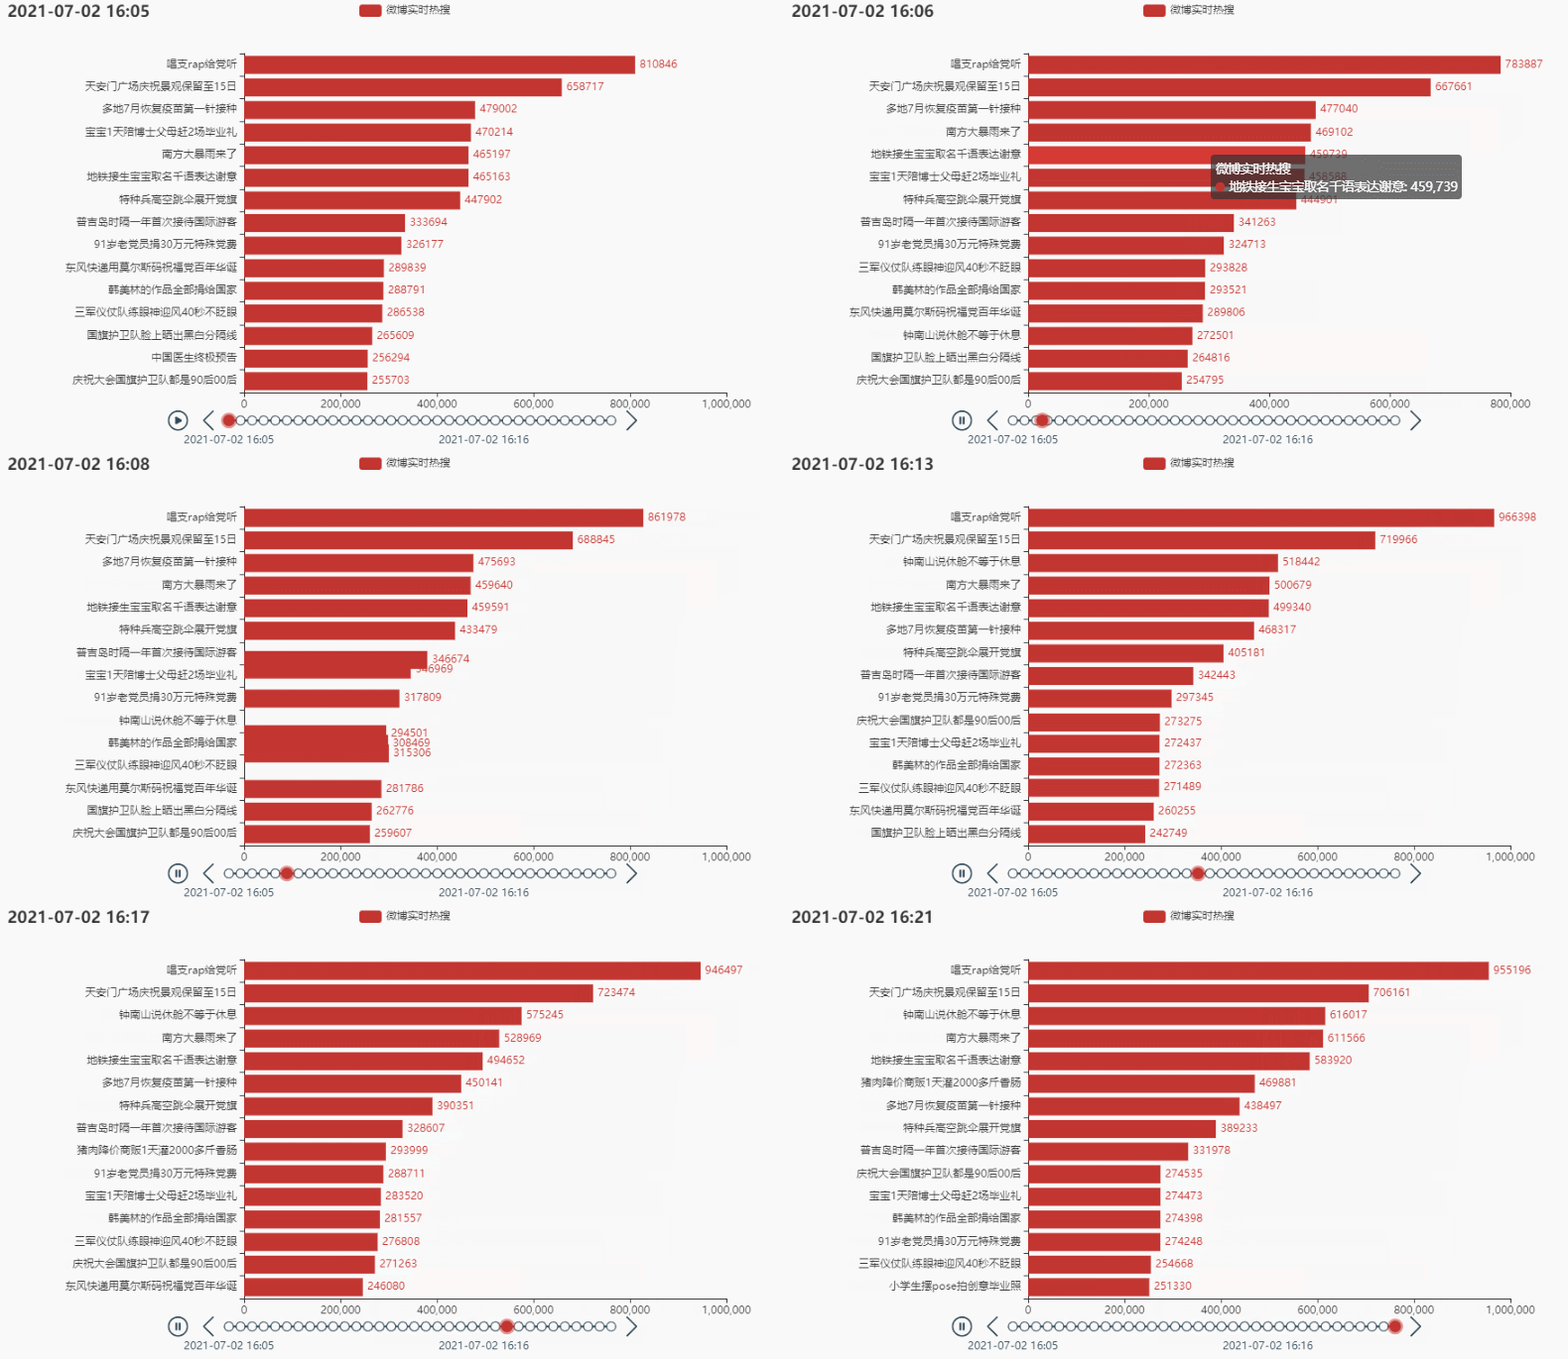
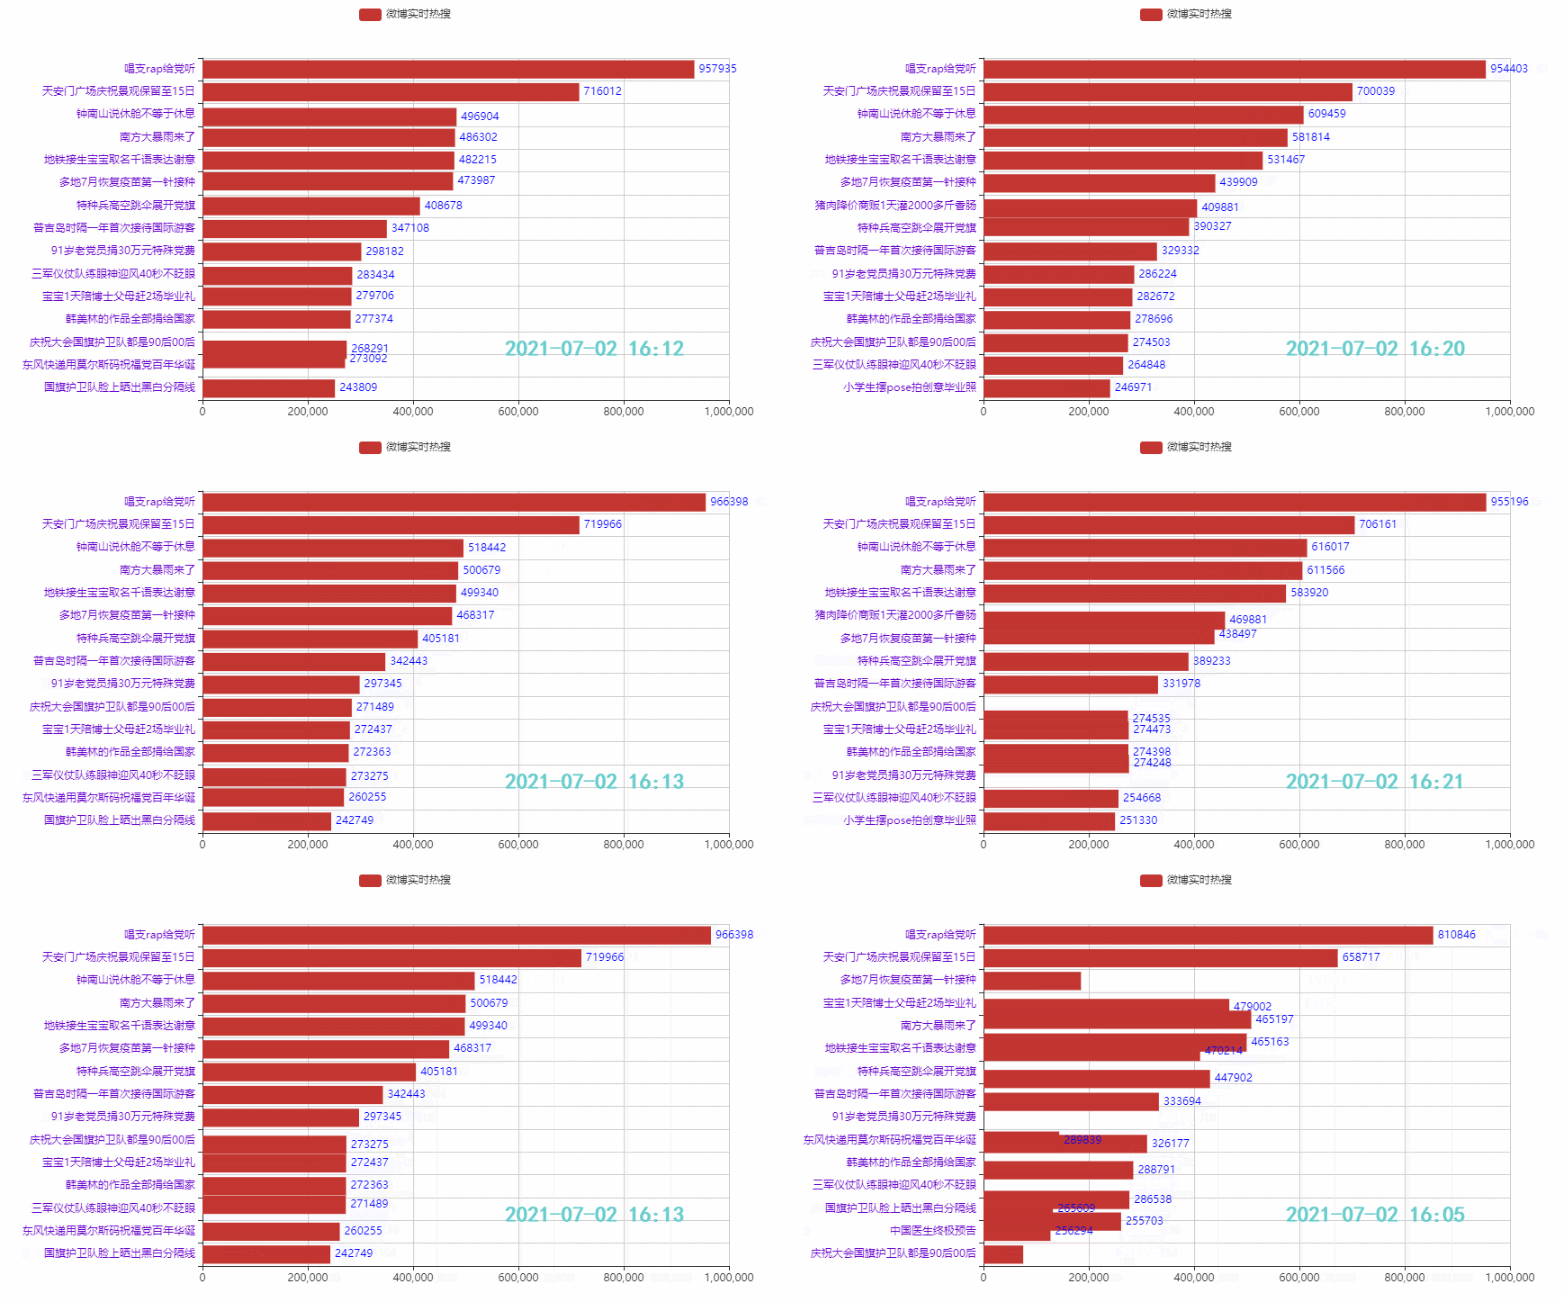
2.4 定制主题,增加图标,设置播放速度
Effect:
zhihu_data = pd.read_csv('zhuhu_hot_datas.csv')
zhihu_data.head()

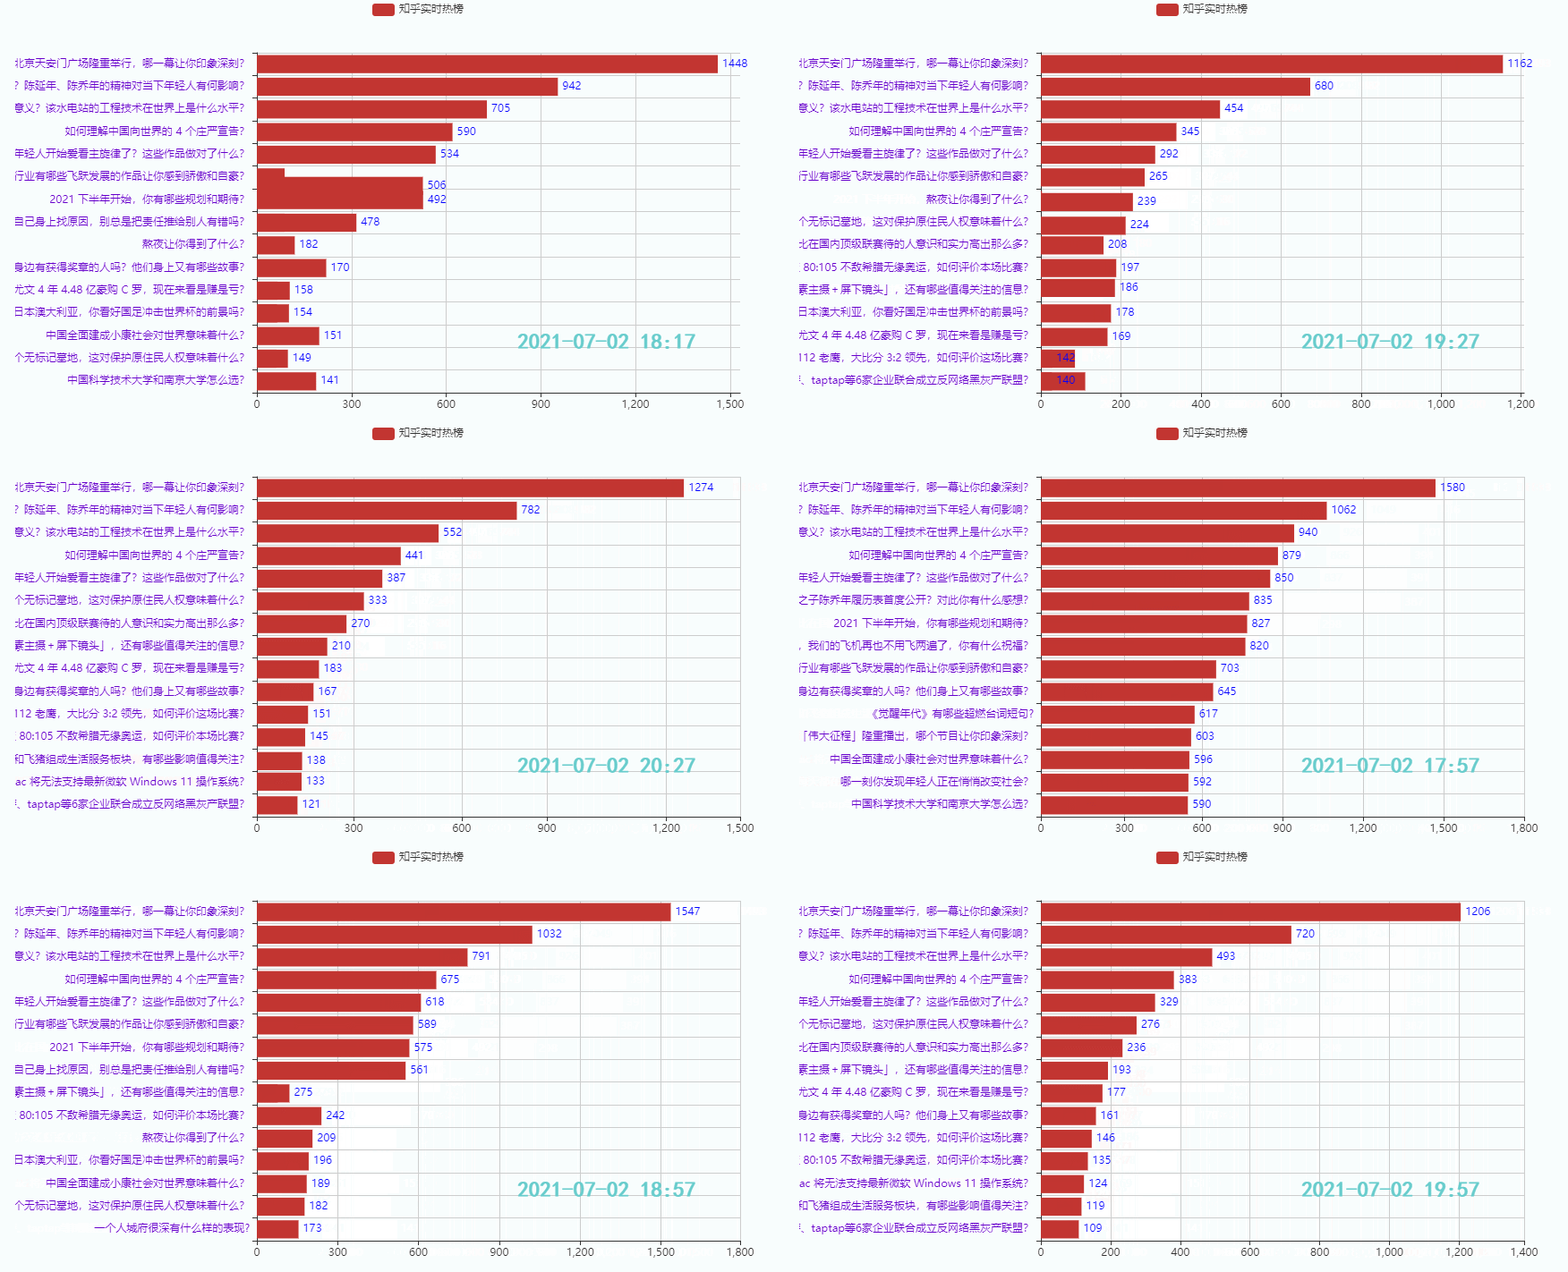
##3.2 Top 15 Hotspots
Effect:
##3.3 Ranking The hot spots of the last 15
## Effect:This issue is mainly to provide friends with an idea for making sequence diagrams. There are many code repetitions, and the Zhihu hot list code is not posted. It's out. If you need it, you can check the code at the link below (Part 1, Part 2), or you can Running online: https://www.heywhale.com/mw/project/60dd1932ee16460017a49d57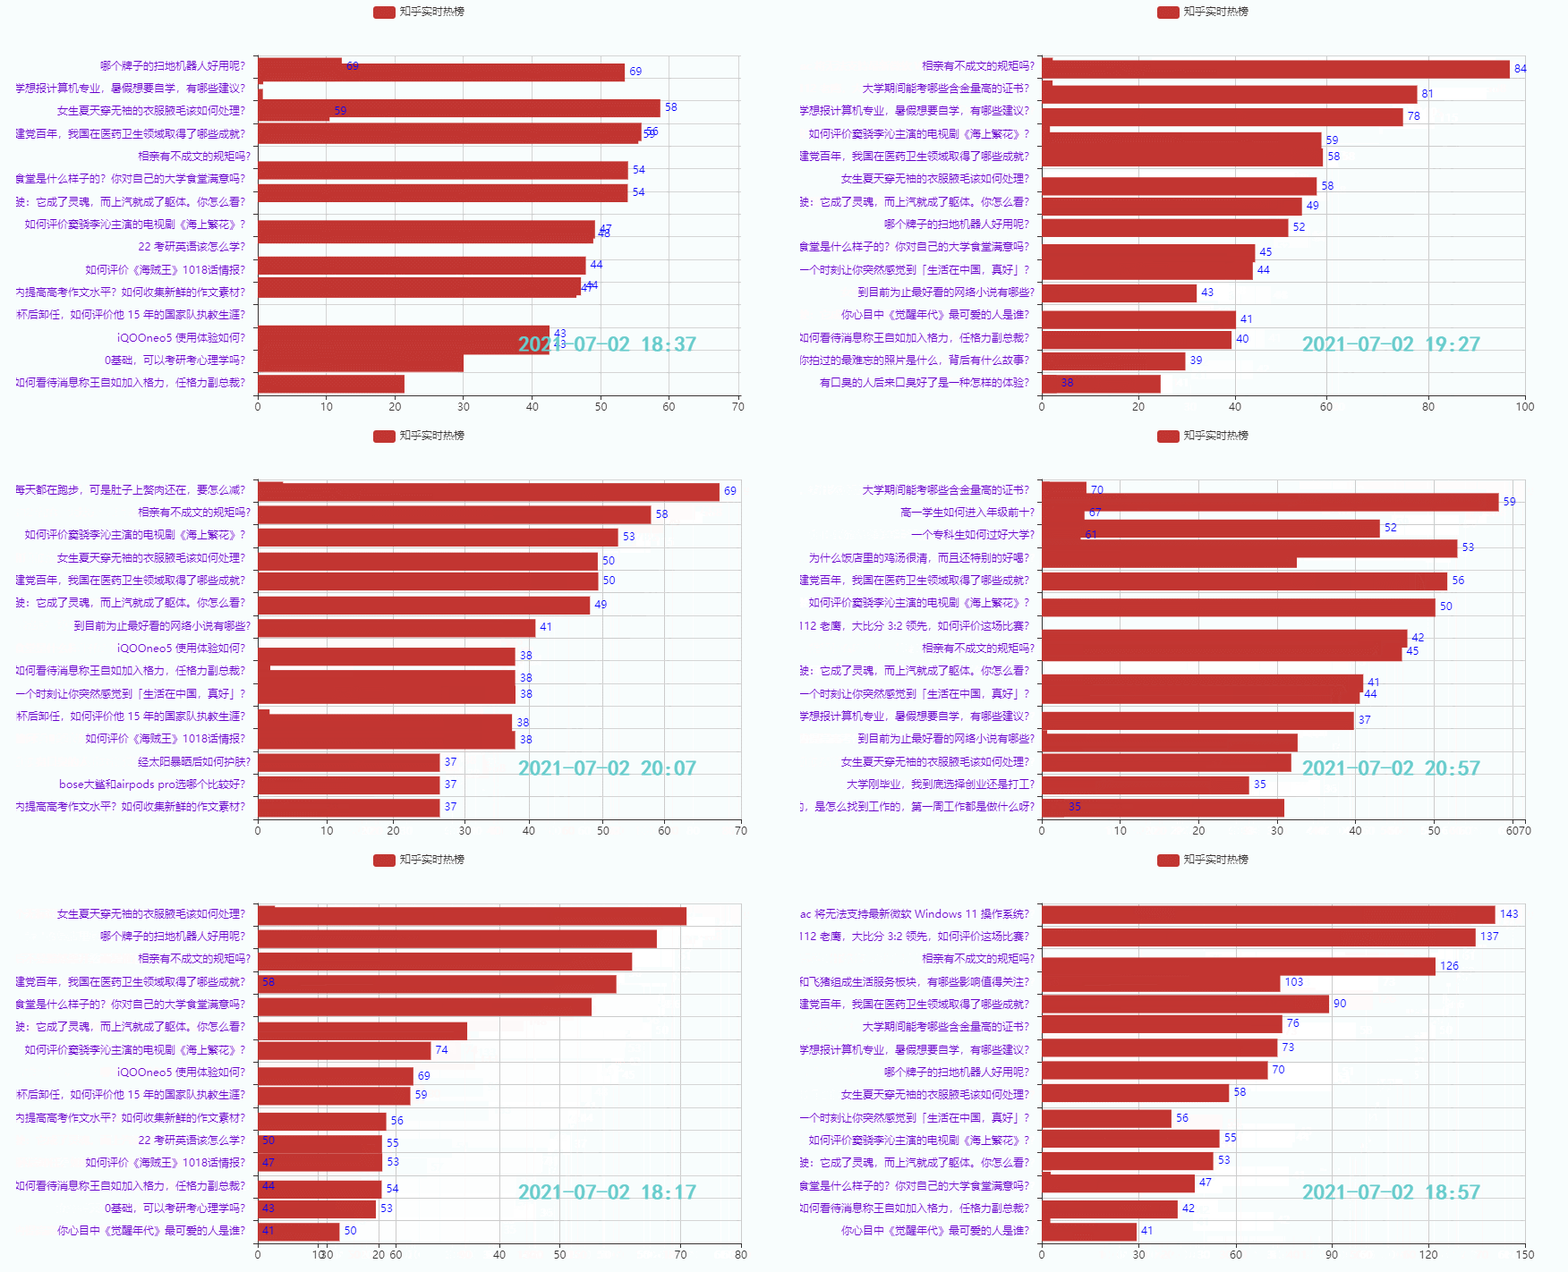
The above is the detailed content of Crawler + Visualization | Python Zhihu Hot List/Weibo Hot Search Sequence Chart (Part 2). For more information, please follow other related articles on the PHP Chinese website!


