Home > Backend Development > Python Tutorial > Visualization | Python analyzes Mid-Autumn mooncakes, these flavors are the yyds!

Visualization | Python analyzes Mid-Autumn mooncakes, these flavors are the yyds!

Release: 2023-08-10 15:25:26
forward
1262 people have browsed it

Visualization | Python analyzes Mid-Autumn mooncakes, these flavors are the yyds!


#Mid-Autumn Festival, also known as Moon Festival, Moonlight Festival, Moon Eve, Autumn Festival, Mid-Autumn Festival, Moon Worship Festival, Moon Niang Festival, Moon Festival, Reunion Festival, etc. are traditional Chinese folk festivals. Since ancient times, there have been folk customs such as worshiping the moon, appreciating the moon, eating moon cakes, playing with lanterns, admiring osmanthus, and drinking osmanthus wine, which have been passed down to this day and lasted for a long time. In this issue, we analyze the sales of Moubao Mid-Autumn Mooncakes to see
which flavors of mooncakes sell well
, Which places sell mooncakes well, I hope it will be helpful to my friends.
##Involved libraries:
Pandas
  • — Data processing

    Pyecharts
  • — Data Visualization

  • jieba — participle
  • collections — Data statistics

Visualization part:

  • ##Bar — Bar chart
  • Pie — Pie Chart
  • Map— Map
  • Stylecloud — Word Cloud
1. Import module
##
import re
import jieba
import stylecloud
import numpy as np
import pandas as pd
from collections import Counter
from pyecharts.charts import Bar
from pyecharts.charts import Map 
from pyecharts.charts import Pie
from pyecharts.charts import Grid
from pyecharts.charts import Page
from pyecharts.components import Image
from pyecharts.charts import WordCloud
from pyecharts import options as opts 
from pyecharts.globals import SymbolType
from pyecharts.commons.utils import JsCode
Copy after login
2. Pandas data deal with

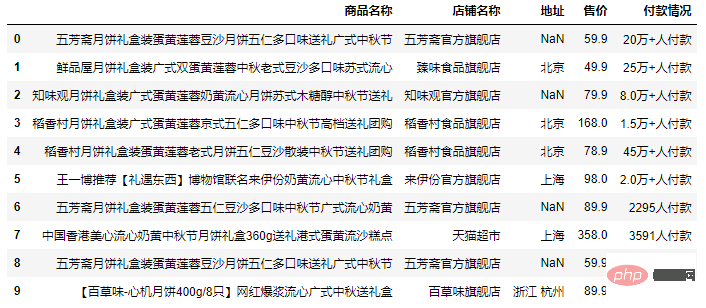
2.1 Read data ##
df = pd.read_excel("月饼.xlsx")
df.head(10)
Copy after login
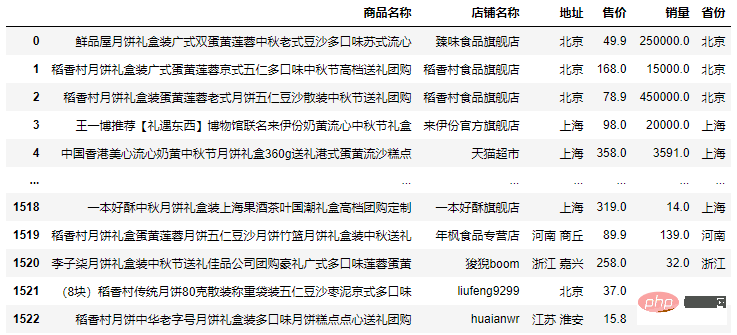
Result:

Visualization | Python analyzes Mid-Autumn mooncakes, these flavors are the yyds!
2.2 去除重复值
print(df.shape)
df.drop_duplicates(inplace=True)
print(df.shape)
Copy after login
(4520, 5)
(1885, 5)
Copy after login
一共有4520条数据,去重后还有1885条数据(某宝一个店铺会在不同页面推荐,导致重复数据比较多)
2.3 空值处理
处理购买人数为空的记录:df['付款情况'] = df['付款情况'].replace(np.nan,'0人付款')
Copy after login

2.4 处理付款情况字段

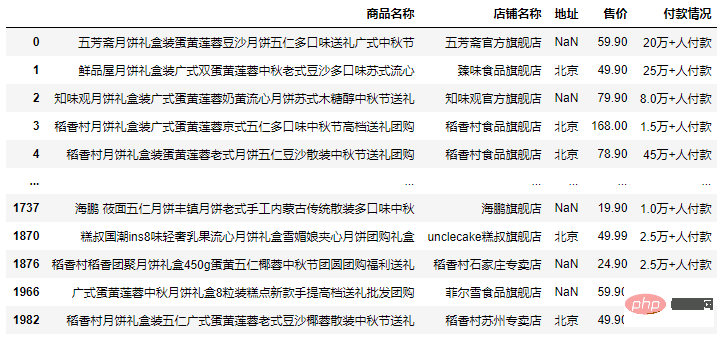
df[df['付款情况'].str.contains("万")]
Copy after login
Visualization | Python analyzes Mid-Autumn mooncakes, these flavors are the yyds!

付款人数超过10000后会直接用""替代,这里我们需要将其恢复:

# 提取数值
df['num'] = [re.findall(r'(\d+\.{0,1}\d*)', i)[0] for i in df['付款情况']] 
df['num'] = df['num'].astype('float')

# 提取单位(万)
df['unit'] = [''.join(re.findall(r'(万)', i)) for i in df['付款情况']] 
df['unit'] = df['unit'].apply(lambda x:10000 if x=='万' else 1)

# 计算销量
df['销量'] = df['num'] * df['unit']
df = df[df['地址'].notna()]
df['省份'] = df['地址'].str.split(' ').apply(lambda x:x[0])

# 删除多余的列
df.drop(['付款情况', 'num', 'unit'], axis=1, inplace=True)

# 重置索引
df = df.reset_index(drop=True)
Copy after login

结果:

Visualization | Python analyzes Mid-Autumn mooncakes, these flavors are the yyds!


3. Pyecharts数据可视化

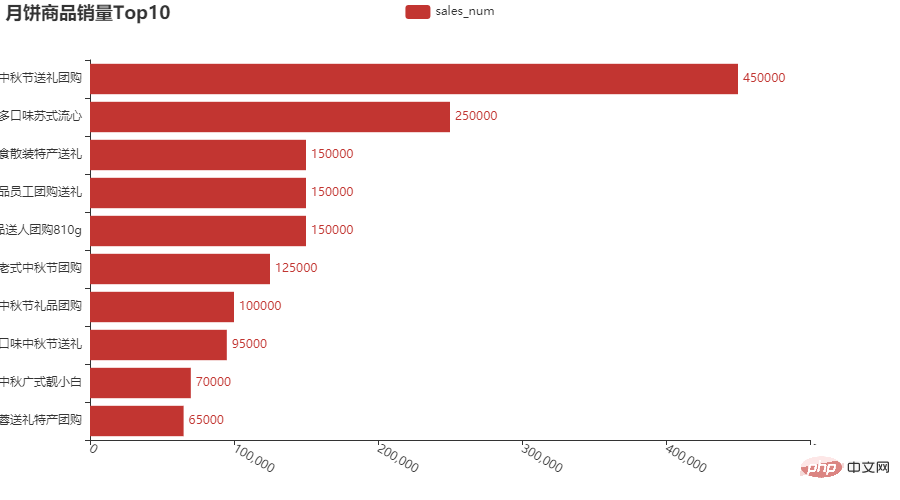
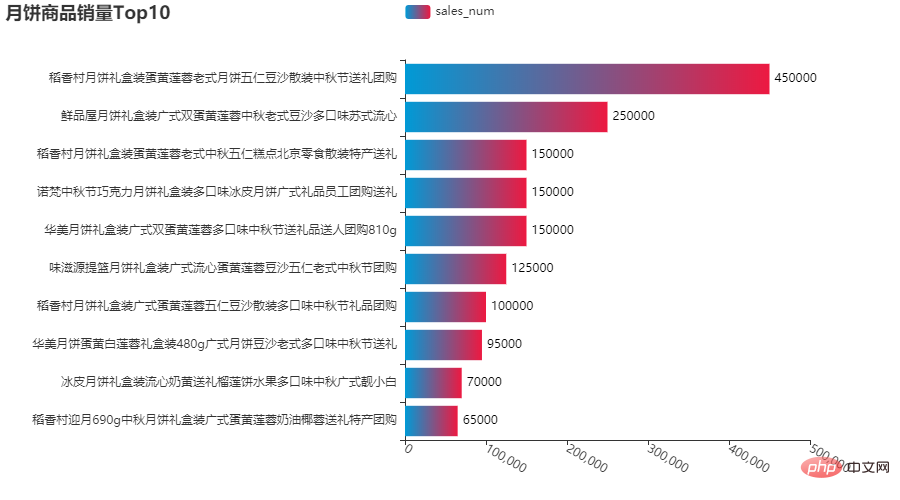
3.1 月饼商品销量Top10

代码:

shop_top10 = df.groupby('商品名称')['销量'].sum().sort_values(ascending=False).head(10)
bar0 = (
    Bar()
        .add_xaxis(shop_top10.index.tolist()[::-1])
        .add_yaxis('sales_num', shop_top10.values.tolist()[::-1])
        .reversal_axis()
        .set_global_opts(title_opts=opts.TitleOpts(title='月饼商品销量Top10'),
                         xaxis_opts=opts.AxisOpts(axislabel_opts=opts.LabelOpts(rotate=-30))) 
        .set_series_opts(label_opts=opts.LabelOpts(position='right'))
)
Copy after login

效果:

Visualization | Python analyzes Mid-Autumn mooncakes, these flavors are the yyds!

商品名称太长显示不全,我们调整一下边距

bar1 = (
    Bar()
        .add_xaxis(shop_top10.index.tolist()[::-1])
        .add_yaxis('sales_num', shop_top10.values.tolist()[::-1],itemstyle_opts=opts.ItemStyleOpts(color=JsCode(color_js)))
        .reversal_axis()
        .set_global_opts(title_opts=opts.TitleOpts(title='月饼商品销量Top10'),
             xaxis_opts=opts.AxisOpts(axislabel_opts=opts.LabelOpts(rotate=-30)),
             ) 
        .set_series_opts(label_opts=opts.LabelOpts(position='right'))
)
# 将图形整体右移
grid = (
    Grid()
        .add(bar1, grid_opts=opts.GridOpts(pos_left='45%', pos_right='10%')) 
)
Copy after login
Visualization | Python analyzes Mid-Autumn mooncakes, these flavors are the yyds!
这样是不是好多了。

还可以来些其他(比如:形状)设置:

Visualization | Python analyzes Mid-Autumn mooncakes, these flavors are the yyds!

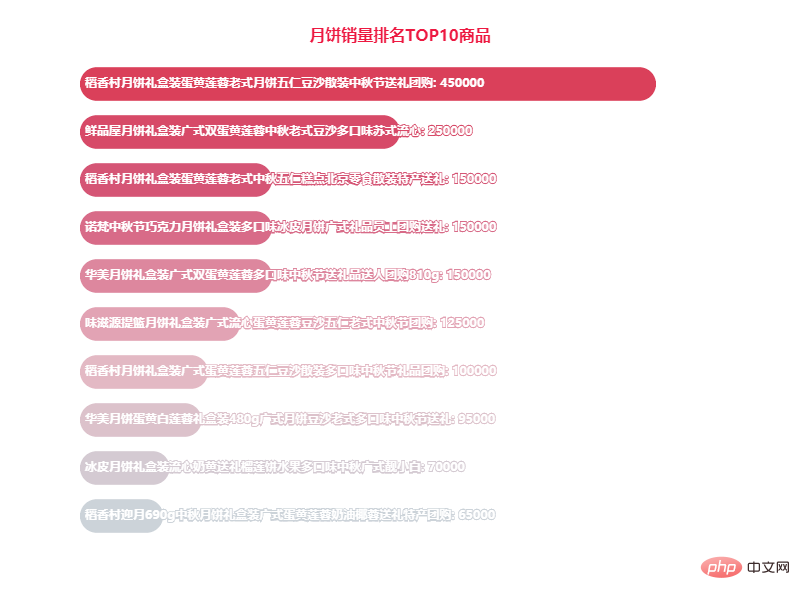
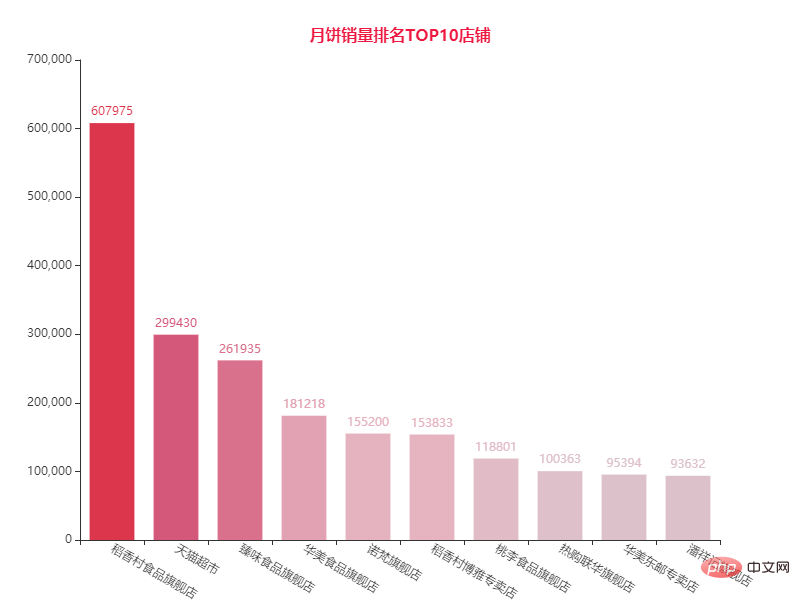
3.2 月饼销量排名TOP10店铺

代码:

shop_top10 = df.groupby('店铺名称')['销量'].sum().sort_values(ascending=False).head(10)
bar3 = (
    Bar(init_opts=opts.InitOpts(
        width='800px', height='600px',))
    .add_xaxis(shop_top10.index.tolist())
    .add_yaxis('', shop_top10.values.tolist(),
               category_gap='30%',
              )

    .set_global_opts(
        xaxis_opts=opts.AxisOpts(axislabel_opts=opts.LabelOpts(rotate=-30)),
        title_opts=opts.TitleOpts(
            title='月饼销量排名TOP10店铺',
            pos_left='center',
            pos_top='4%',
            title_textstyle_opts=opts.TextStyleOpts(
                color='#ed1941', font_size=16)
        ),
        visualmap_opts=opts.VisualMapOpts(
            is_show=False,
            max_=600000,
            range_color=["#CCD3D9", "#E6B6C2", "#D4587A","#FF69B4", "#DC364C"]
        ),
     )
)
bar3.render_notebook()
Copy after login
效果:

Visualization | Python analyzes Mid-Autumn mooncakes, these flavors are the yyds!

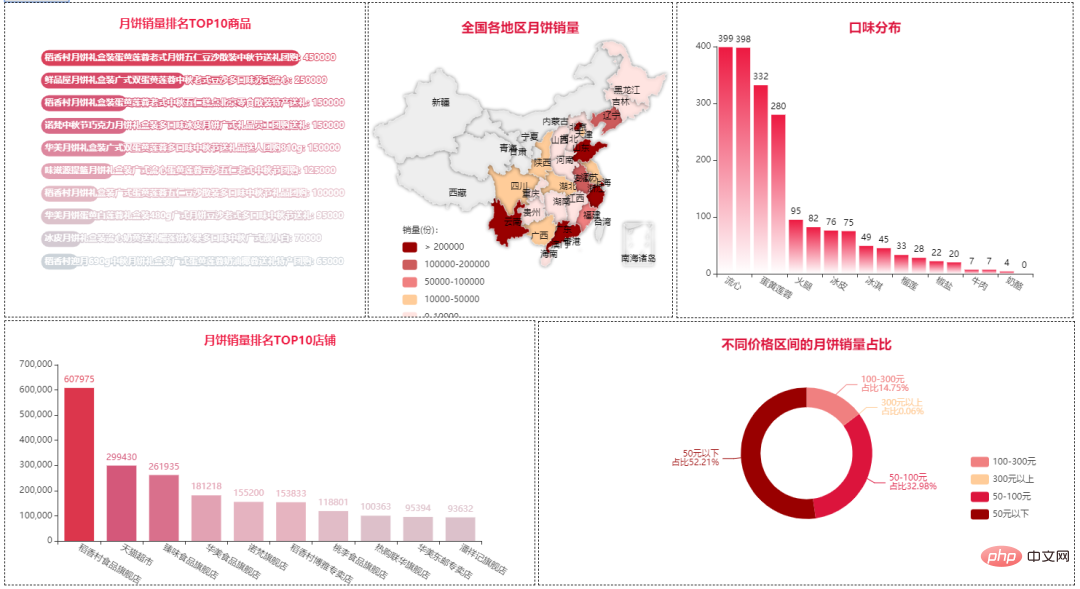
稻香村的月饼销量遥遥领先。

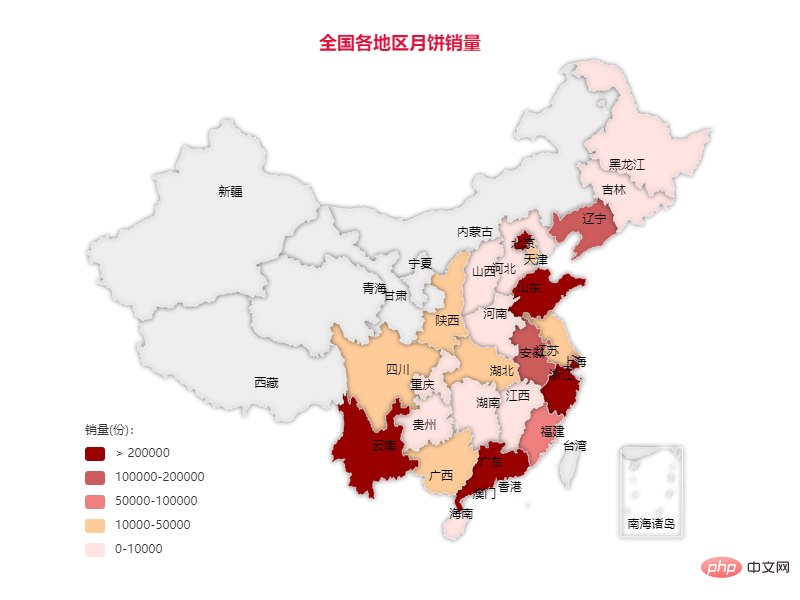
3.3 全国各地区月饼销量

province_num = df.groupby('省份')['销量'].sum().sort_values(ascending=False) 
map_chart = Map(init_opts=opts.InitOpts(theme='light',
                                        width='800px',
                                        height='600px'))
map_chart.add('',
              [list(z) for z in zip(province_num.index.tolist(), province_num.values.tolist())],
              maptype='china',
              is_map_symbol_show=False,
              itemstyle_opts={
                  'normal': {
                      'shadowColor': 'rgba(0, 0, 0, .5)', # 阴影颜色
                      'shadowBlur': 5, # 阴影大小
                      'shadowOffsetY': 0, # Y轴方向阴影偏移
                      'shadowOffsetX': 0, # x轴方向阴影偏移
                      'borderColor': '#fff'
                  }
              }
              )
map_chart.set_global_opts(
    visualmap_opts=opts.VisualMapOpts(
        is_show=True,
        is_piecewise=True,
        min_ = 0,
        max_ = 1,
        split_number = 5,
        series_index=0,
        pos_top='70%',
        pos_left='10%',
        range_text=['销量(份):', ''],
        pieces=[
            {'max':2000000, 'min':200000, 'label':'> 200000', 'color': '#990000'},
            {'max':200000, 'min':100000, 'label':'100000-200000', 'color': '#CD5C5C'},
            {'max':100000, 'min':50000, 'label':'50000-100000', 'color': '#F08080'},
            {'max':50000, 'min':10000, 'label':'10000-50000', 'color': '#FFCC99'},
            {'max':10000, 'min':0, 'label':'0-10000', 'color': '#FFE4E1'},
           ],
    ),
    legend_opts=opts.LegendOpts(is_show=False), 
    tooltip_opts=opts.TooltipOpts(
        is_show=True,
        trigger='item',
        formatter='{b}:{c}'
    ),
    title_opts=dict(
        text='全国各地区月饼销量',
        left='center',
        top='5%',
        textStyle=dict(
            color='#DC143C'))
)
map_chart.render_notebook()
Copy after login

结果:

Visualization | Python analyzes Mid-Autumn mooncakes, these flavors are the yyds!

From the geographical distribution map, stores are mainly distributed in Beijing, Shandong, Zhejiang, Guangdong, Yunnan and other southeastern regions.
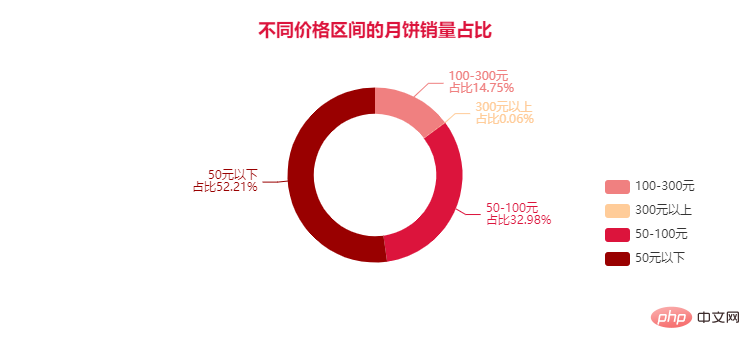
3.4 Proportion of mooncake sales in different price ranges

Visualization | Python analyzes Mid-Autumn mooncakes, these flavors are the yyds!

可以看到,50以下的月饼销量占比达到了52%,超过了半数的月饼售价在50元以内,100The sales proportion of mooncakes below has reached as much as 85%. Although there are some with prices above 1,000 yuan, the overall price is still relatively affordable.
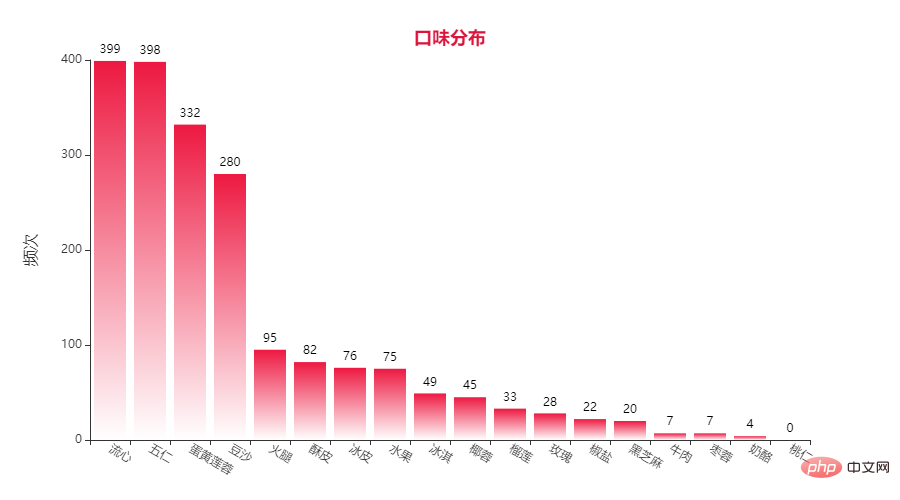
3.5 Mooncake flavor distribution

Visualization | Python analyzes Mid-Autumn mooncakes, these flavors are the yyds!

流心##、Five kernels, egg yolk lotus paste, bean paste yyds! ! !
3.6 Word Cloud
Visualization | Python analyzes Mid-Autumn mooncakes, these flavors are the yyds!
##The amount of code is relatively large. Due to space reasons, part of the code is not fully displayed. If necessary, it can be obtained below, or is available online. Run (including all code)
https://www.heywhale .com/mw/project/61404e0ff0de6200174ada20

The above is the detailed content of Visualization | Python analyzes Mid-Autumn mooncakes, these flavors are the yyds!. For more information, please follow other related articles on the PHP Chinese website!

Related labels:
source:Python当打之年
Statement of this Website
The content of this article is voluntarily contributed by netizens, and the copyright belongs to the original author. This site does not assume corresponding legal responsibility. If you find any content suspected of plagiarism or infringement, please contact admin@php.cn
Popular Tutorials
More>
Latest Downloads
More>
Web Effects
Website Source Code
Website Materials
Front End Template