

After collecting the data, it needs to be interpreted and analyzed , to gain a deeper understanding of the meaning contained in the data. And this meaning can be about patterns, trends, or relationships between variables.
Data interpretation is the process of reviewing data through clearly defined methods. Data interpretation helps to give meaning to the data and draw relevant conclusions.
Data analysis is the process of sorting, classifying, and summarizing data to answer research questions. We should complete data analysis quickly and efficiently and draw conclusions that stand out.
Different visual data drawing types are an important aspect to achieve the above goals. As data continues to grow, this need continues to grow, so data visualization diagrams are very important. However, there are many types of data visualization diagrams, and in actual work, it is often difficult to choose the type that is most suitable for the current business or data.
Research shows that the human eye is a high-bandwidth parallel GPU with a large number of visual signals, with a bandwidth of 2.339G/s, equivalent to a 20 Gigabit network card, with super strong pattern recognition capabilities, and the processing speed of visual symbols is many orders of magnitude faster than numbers or text. In the era of big data, data visualization is a powerful tool for people to gain insight into the connotation of data and understand the value contained in the data.
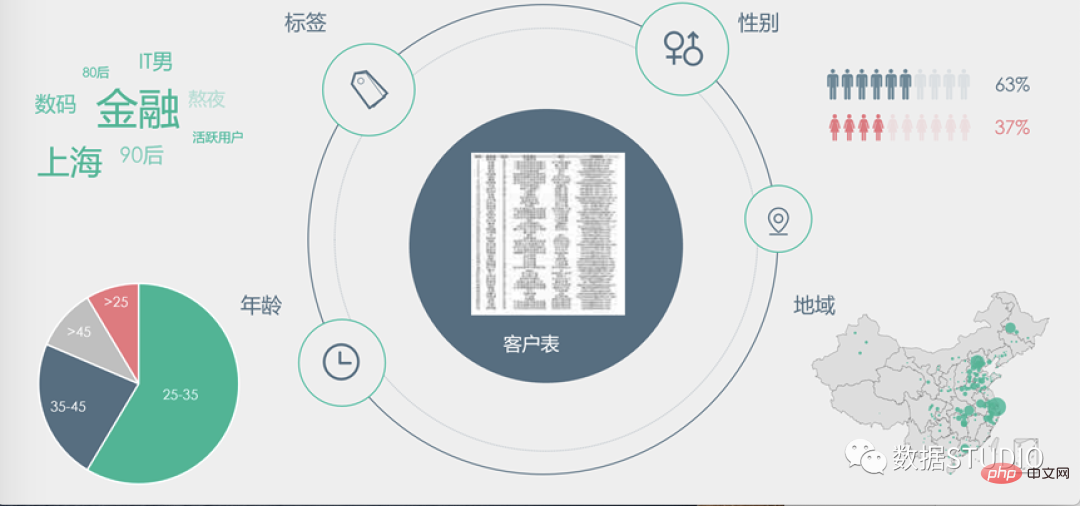
Therefore, visualization is often used to assist decision-making. As shown in the picture above, there is a dense customer table in the middle. What valuable information can be obtained to guide decision-making? Just looking at rows and columns of data may take a long time to draw some conclusions, but after visualization, we can easily grasp the conclusions quickly through various forms of visualization to assist decision-making.
This is: Visual analysis, which is to refine information into knowledge, play the role of "seeing things to know", and facilitate decision-makers to analyze complex, large-scale, Quickly mine effective information from multi-dimensional data.
This article summarizes and introduces various visualization diagrams and their suitable usage scenarios, and also shows the code for drawing these diagrams using commonly used drawing packages (plotly, seaborn and matplotlib).
A bar chart is a graph that uses rectangular bars to display categorical data. The height or length of these bars is proportional to the value they represent. Bars can be vertical or horizontal. Vertical bar charts are sometimes called column charts.
Below is a bar chart indicating Canada's population by year.
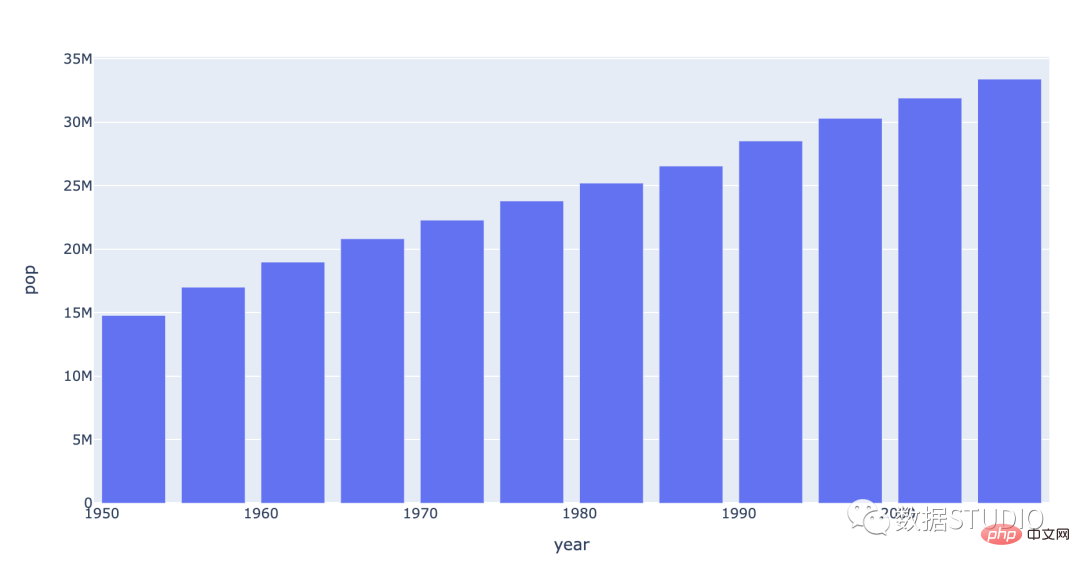
Bar charts are suitable for comparison of categorical data. When horizontally placed, they are also called bar charts. Note: The number of bar chart data should not exceed 12; the number of bar chart data should not exceed 30.
import plotly.express as px
data_canada = px.data.gapminder().query("country == 'Canada'")
fig = px.bar(data_canada, x='year', y='pop')
fig.show()import seaborn as sns
sns.set_context({'figure.figsize':[14, 8]})
sns.set_theme(style="whitegrid")
ax = sns.barplot(x="year", y="pop", data=data_canada)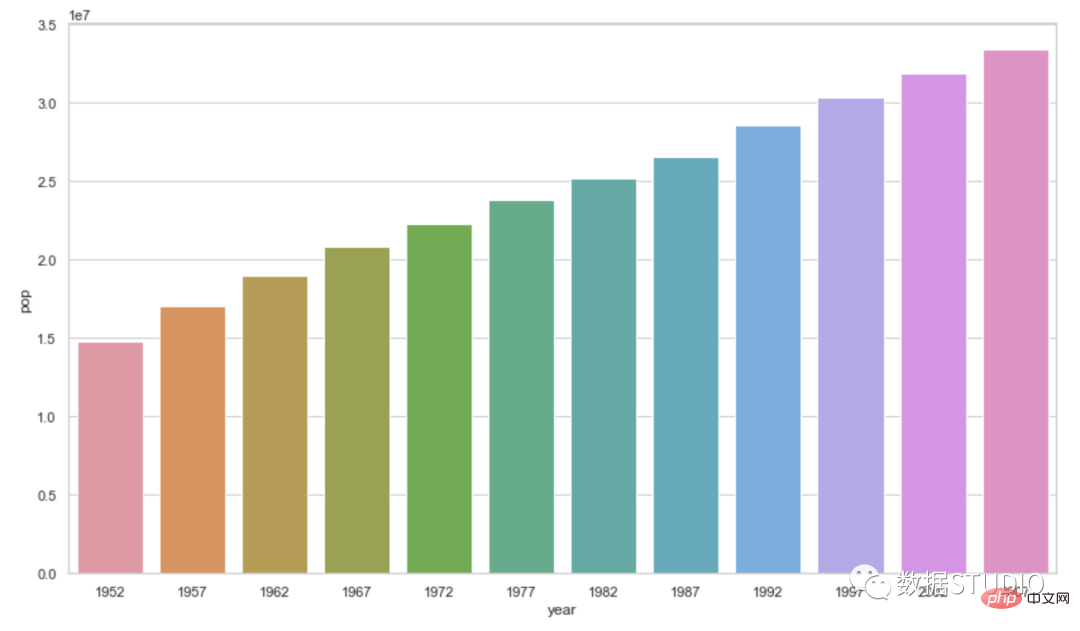
sns.set_context({'figure.figsize':[20, 20]})
sns.boxplot(x)from matplotlib import pyplot as plt import seaborn as sns plt.figure(figsize=(20,20)) # 或者 plt.rcParams['figure.figsize'] = (20.0, 20.0) sns.distplot(launch.date) plt.show()
ax = sns.boxplot(x)
ax.figure.set_size_inches(12,6)
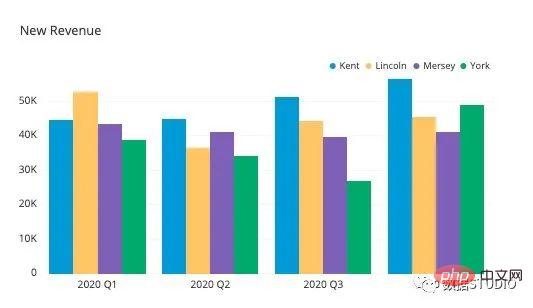
Grouped bar charts are used when the dataset has subgroups that need to be visualized graphically. Subgroups are distinguished by different colors. Here is a description of such a chart:
import plotly.express as px
df = px.data.tips()
fig = px.bar(df, x="sex", y="total_bill",
             color='smoker', barmode='group',
             height=500)
fig.show()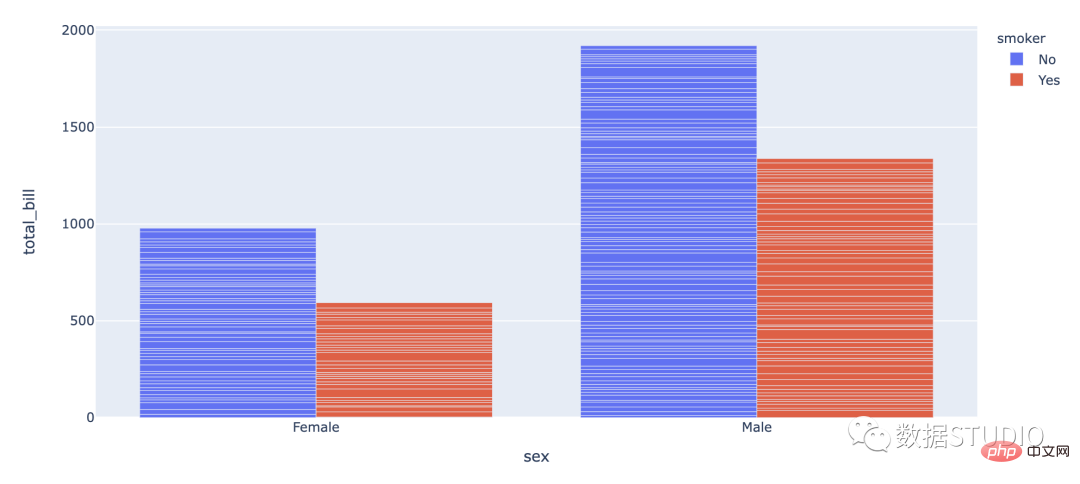
import seaborn as sb
df = sb.load_dataset('tips')
df = df.groupby(['size', 'sex']).agg(mean_total_bill=("total_bill", 'mean'))
df = df.reset_index()
sb.barplot(x="size", y="mean_total_bill",
           hue="sex", data=df)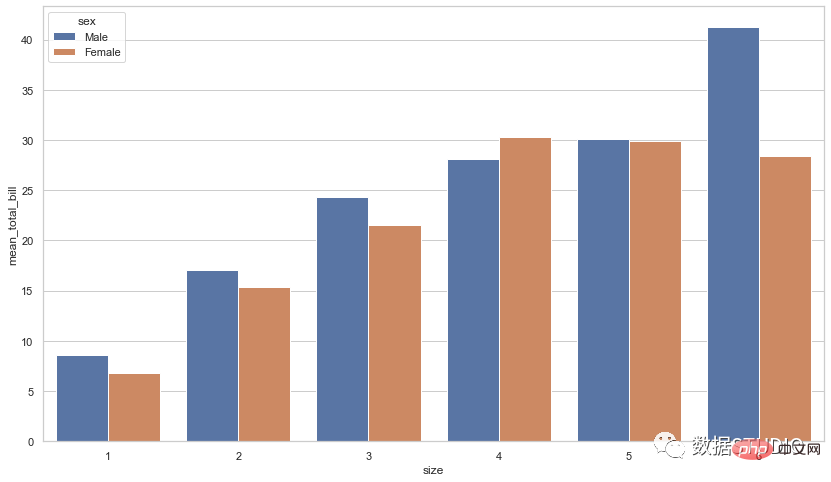
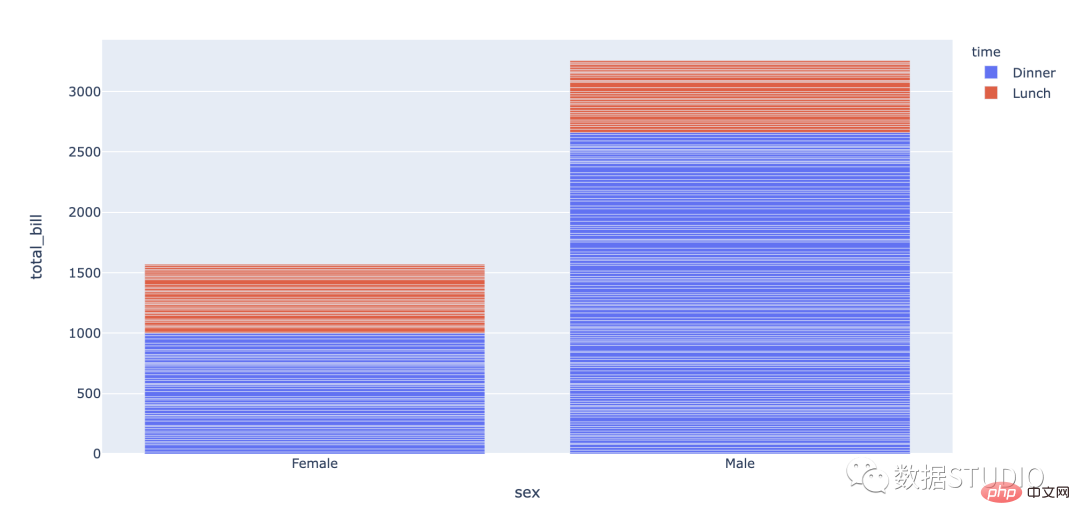
堆叠条形图用于显示数据集子组。堆叠柱状图将每个柱子进行分割以显示相同类型下各个数据的大小情况。
分类:
数据可视化类型的概念与代码.jpg
import plotly.express as px
df = px.data.tips()
fig = px.bar(df, x="sex", y="total_bill", color='time')
fig.show()
import pandas
import matplotlib.pylab as plt
import seaborn as sns
plt.rcParams["figure.figsize"] = [12, 6]
plt.rcParams["figure.autolayout"] = True
df = pandas.DataFrame(dict(
   number=[2, 5, 1, 6, 3],
   count=[56, 21, 34, 36, 12],
   select=[29, 13, 17, 21, 8]
))
bar_plot1 = sns.barplot(x='number', y='count',
                        data=df, label="count",
                        color="red")
bar_plot2 = sns.barplot(x='number', y='select',
                        data=df, label="select",
                        color="green")
plt.legend(ncol=2, loc="upper right",
           frameon=True, fontsize=15)
plt.xlabel('number', fontsize=15)
plt.ylabel('select',fontsize=15)
plt.xticks(fontsize=15)
plt.yticks(fontsize=15)
plt.show()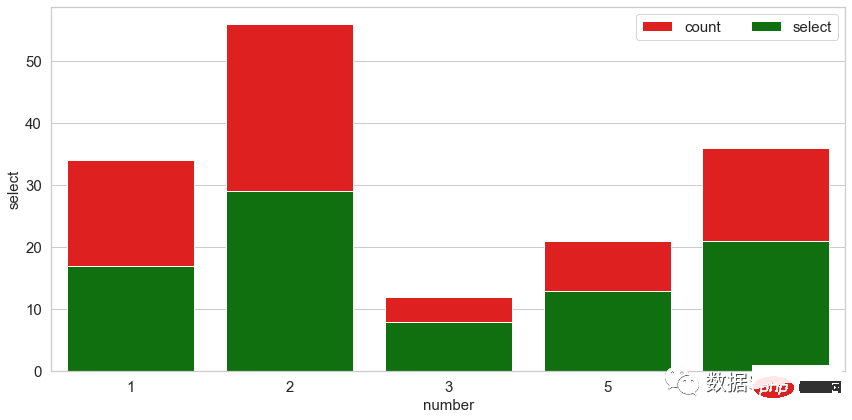
这是堆叠条形图的类型,其中每个堆叠条形显示其离散值占总值的百分比。总百分比为 100%。
它将一系列数据点显示为标记。这些点通常按其 x 轴值排序。这些点用直线段连接。折线图用于可视化一段时间内数据的趋势。
以下是折线图中按年计算的加拿大预期寿命的说明。
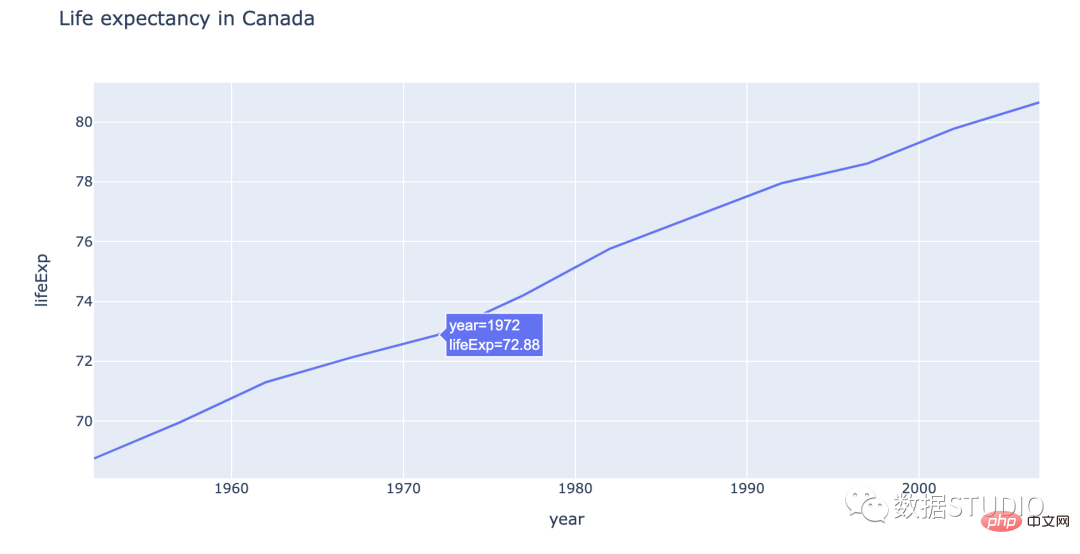
以下是如何在情节中做到这一点:
import plotly.express as px
df = px.data.gapminder().query("country=='Canada'")
fig = px.line(df, x="year", y="lifeExp",
              title='Life expectancy in Canada')
fig.show()以下是在 seabron 中的操作方法:
import seaborn as sns
sns.lineplot(data=df,
              x="year",
              y="lifeExp")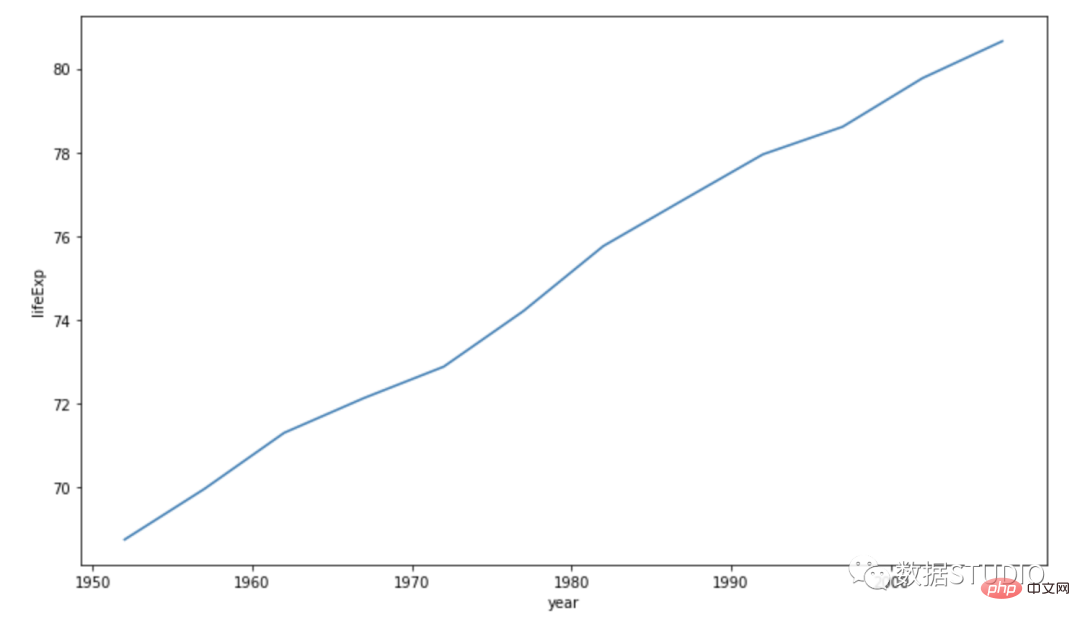
简单的折线图仅在图形上绘制一条线。其中一个轴定义了自变量。另一个轴包含一个依赖于它的变量。
多条线图包含多条线。它们代表数据集中的多个变量。这种类型的图表可用于研究同一时期的多个变量。
import plotly.express as px
df = px.data.gapminder().query("continent == 'Oceania'")
fig = px.line(df, x='year', y='lifeExp',               color='country')fig.show()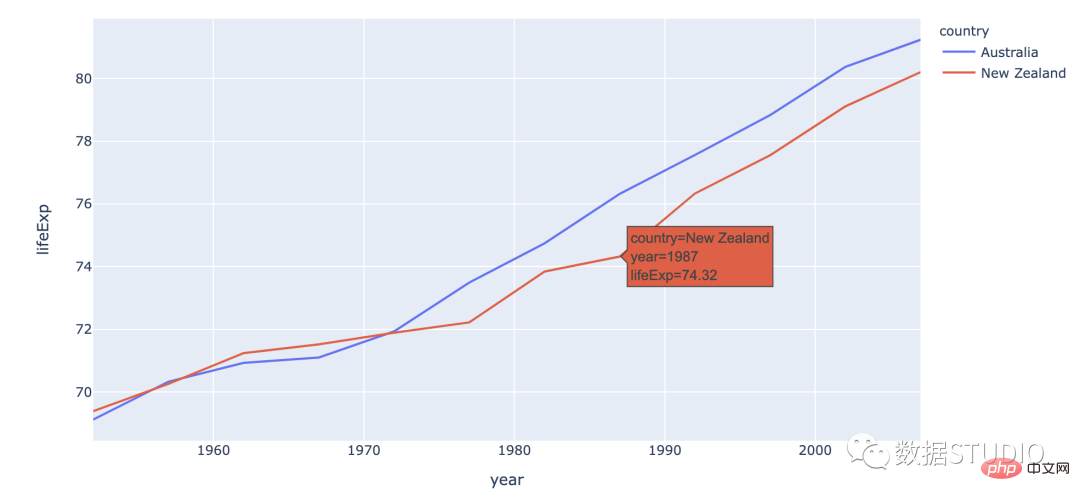
import seaborn as snssns.line
plot(data=df, x='year',
     y='lifeExp', hue='country')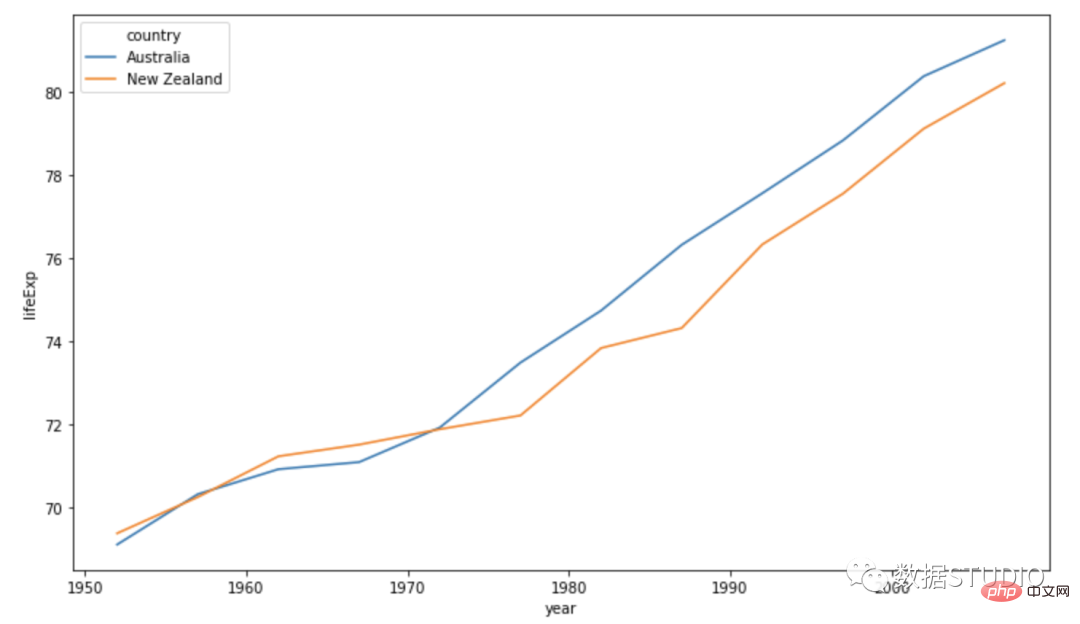
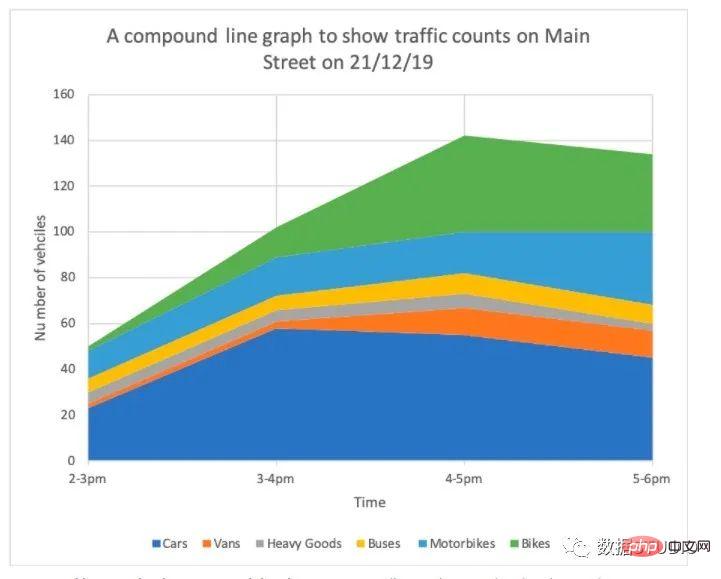
它是简单折线图的扩展。它用于处理来自较大数据集的不同数据组。它的每个折线图都向下阴影到 x 轴。它让每一组彼此堆叠。
复合折线图也可以称作堆叠面积图,堆叠面积图和基本面积图一样,唯一的区别就是图上每一个数据集的起点不同,起点是基于前一个数据集的,用于显示每个数值所占大小随时间或类别变化的趋势线,展示的是部分与整体的关系。
适用: 堆叠面积图不适用于表示带有负值的数据集。非常适用于对比多变量随时间变化的情况。
分类:
饼图是圆形统计图形。为了说明数字比例,将其分为切片。在饼图中,对于每个切片,其每个弧长都与其代表的数量成正比。中心角和面积也是成比例的。它以切片馅饼命名。饼图广泛得应用在各个领域,用于表示不同分类的占比情况,通过弧度大小来对比各种分类。
适用: 适用于比较一个数据分类上各个模块的大小占比的需求。
注意事项: 饼图不适用于多分类的数据,原则上一张饼图不可多于 9 个分类,因为随着分类的增多,每个切片就会变小,最后导致大小区分不明显,每个切片看上去都差不多大小,这样对于数据的对比是没有什么意义的。所以饼图不适合用于数据量大且分类很多的场景。
import plotly.express as px
df = px.data.gapminder().query("year == 2007").query("continent == 'Europe'")
df.loc[df['pop'] < 2.e6, 'country'] = 'Other countries'
# Represent only large countries
fig = px.pie(df, values='pop', names='country',
title='Population of European continent')
fig.show()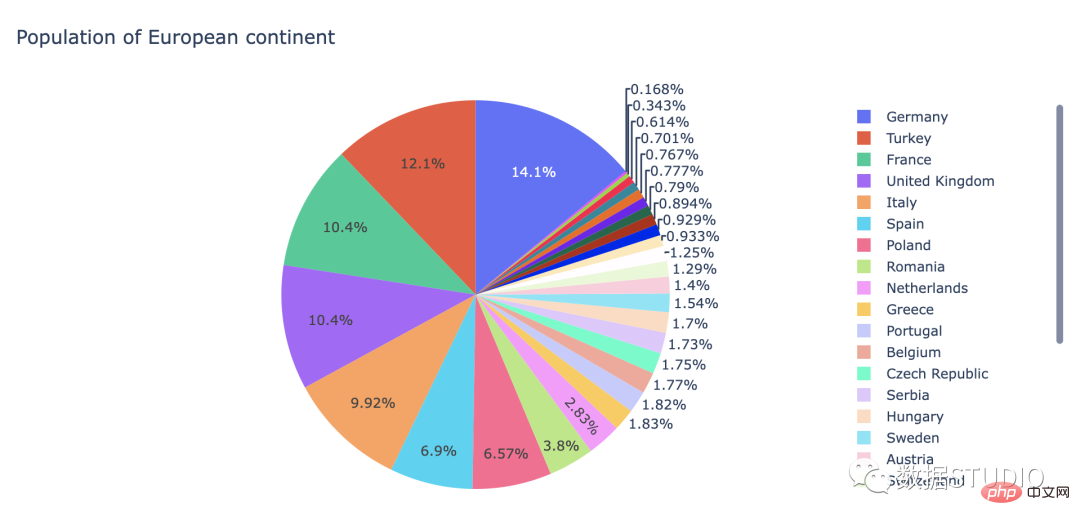
Seaborn 没有创建饼图的默认函数,但 matplotlib 中的以下语法可用于创建饼图并添加 seaborn 调色板:
import matplotlib.pyplot as plt
import seaborn as sns

data = [15, 25, 25, 30, 5]
labels = ['Group 1', 'Group 2', 'Group 3', 'Group 4', 'Group 5']

colors = sns.color_palette('pastel')[0:5]

plt.pie(data, labels = labels, colors = colors, autopct='%.0f%%')
plt.show()
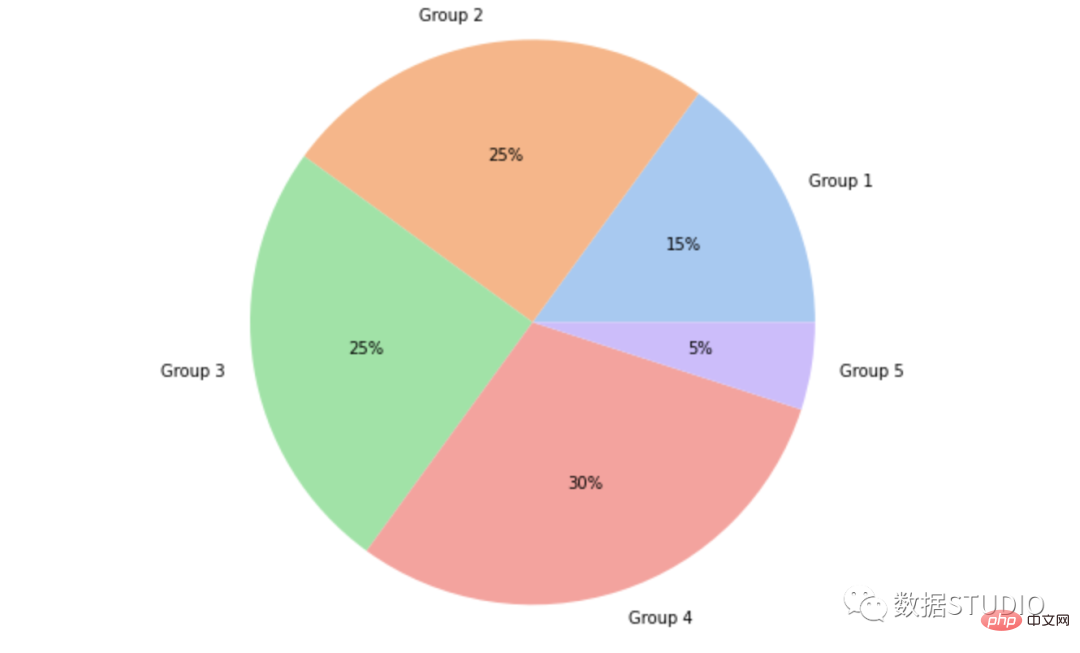
这是饼图的基本类型。它通常被称为饼图。
图表的一个或多个扇区与分解饼图中的图表分开(称为分解)。它用于强调数据集中的特定元素。
这是一种以情节方式执行此操作的方法:
import plotly.graph_objects as golabels = ['Oxygen','Himport plotly.graph_objects as go

labels = ['Oxygen','Hydrogen',
          'Carbon_Dioxide','Nitrogen']
values = [4500, 2500, 1053, 500]

# 拉力是扇形半径的一个分数
fig = go.Figure(data=[go.Pie(labels=labels,
                             values=values, pull=[0, 0, 0.2, 0])])
fig.show()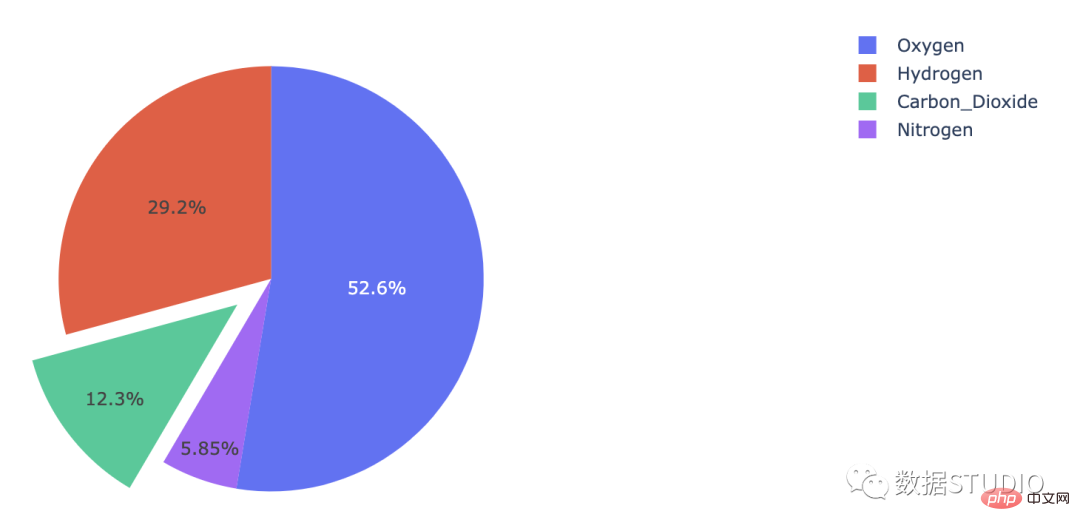
在 seaborn 中,matplotlib 中 pie 方法的爆炸属性可以用作:
import matplotlib.pyplot as plt
import seaborn as sns

data = [15, 25, 25, 30, 5]
labels = ['Group 1', 'Group 2', 'Group 3', 'Group 4', 'Group 5']

colors = sns.color_palette('pastel')[0:5]

plt.pie(data, labels = labels,
        colors = colors,
        autopct='%.0f%%',
        explode = [0, 0, 0, 0.2, 0])
plt.show()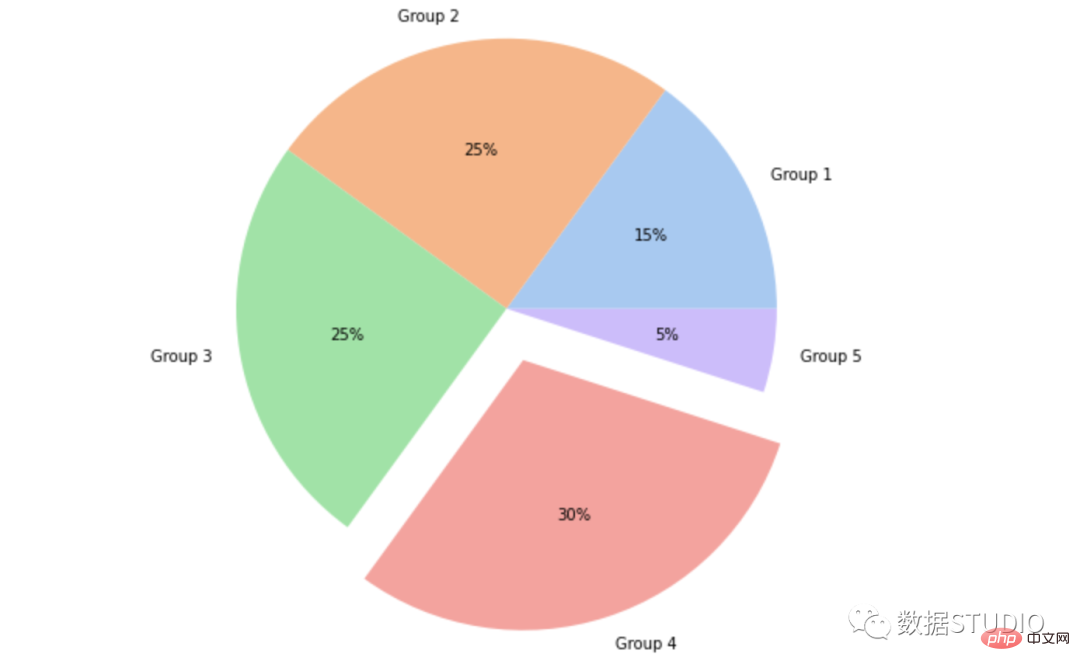
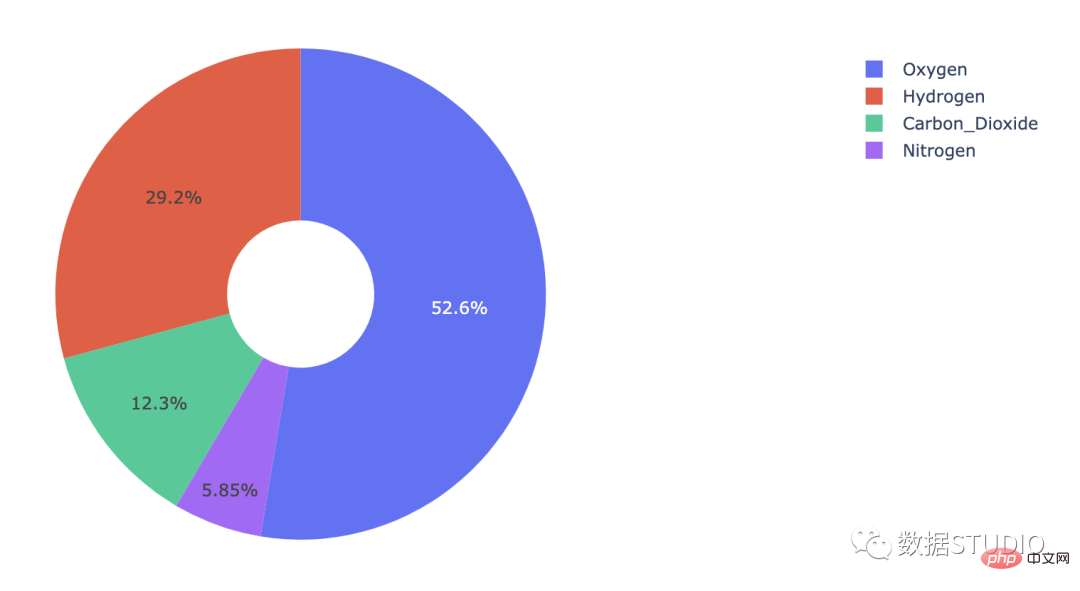
在这个饼图中,中心有一个洞。这个洞使它看起来像一个甜甜圈,它的名字由此而来。
甜甜圈图也可称为环图,环图本质是饼图将中间区域挖空;环图相对于饼图空间的利用率更高,比如我们可以使用它的空心区域显示文本信息,标题等。
import plotly.graph_objects as go

labels = ['Oxygen','Hydrogen','Carbon_Dioxide','Nitrogen']
values = [4500, 2500, 1053, 500]

# 使用“hole”创建一个类似甜甜圈的饼图
fig = go.Figure(data=[go.Pie(labels=labels, values=values, hole=.3)])
fig.show()
import numpy as np
# import matplotlib.pyplot as plt
data = np.random.randint(20, 100, 6)
plt.pie(data,
          autopct='%3.1f%%',
          radius=1,
          pctdistance=0.85,
          startangle=90,
          counterclock=False,
          # 锲形块边界属性字典
          wedgeprops={'edgecolor': 'white',
                      'linewidth': 1,
                      'linestyle': '-'
                      },
          # 锲形块标签文本和数据标注文本的字体属性
          textprops=dict(color='k',  #  字体颜色
                         fontsize=14,
                         family='Arial'
                         ))
circle = plt.Circle( (0,0), 0.7, color='white')
p=plt.gcf()
p.gca().add_artist(circle)
plt.show()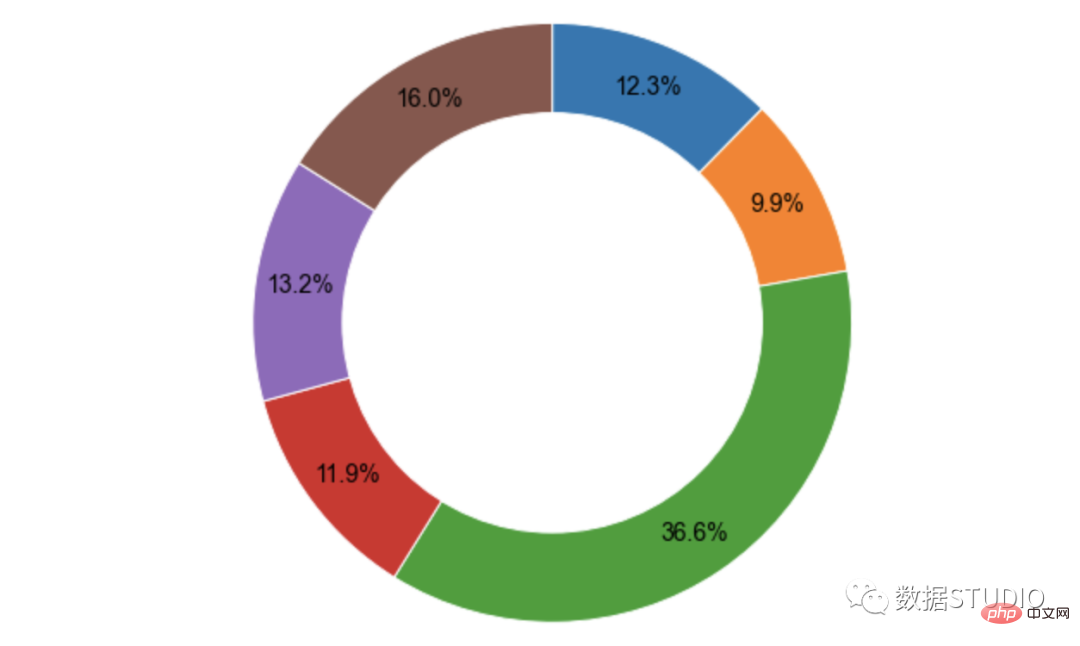
# Libraries
import matplotlib.pyplot as plt

# Make data: I have 3 groups and 7 subgroups
# 设置数据
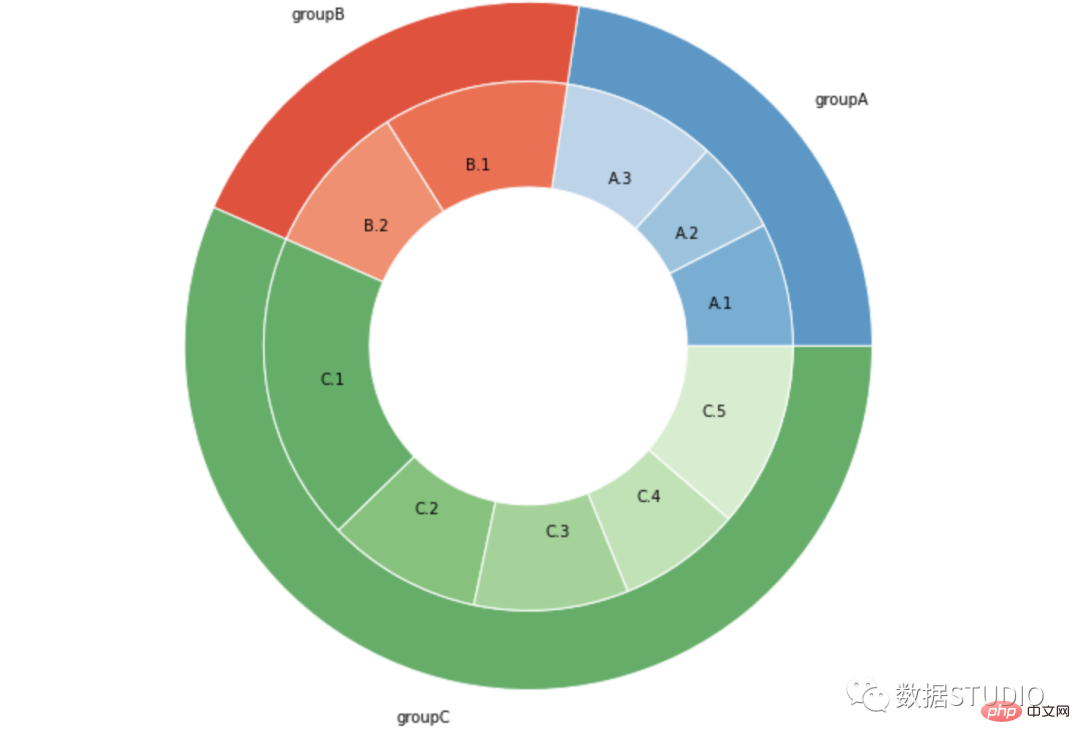
group_names=['groupA', 'groupB', 'groupC']
group_size=[12,11,30]
subgroup_names=['A.1', 'A.2', 'A.3', 'B.1', 'B.2', 'C.1', 'C.2', 'C.3', 'C.4', 'C.5']
subgroup_size=[4,3,5,6,5,10,5,5,4,6]

# Create colors
# 设置颜色
a, b, c=[plt.cm.Blues, plt.cm.Reds, plt.cm.Greens]

# First Ring (outside)
# 外圈
fig, ax = plt.subplots()
# 设置等比例轴,x和y轴等比例
ax.axis('equal')
# 画饼图
mypie, _ = ax.pie(group_size, radius=1.3, labels=group_names, colors=[a(0.6), b(0.6), c(0.6)],wedgeprops=dict(width=0.3, edgecolor='white'));

# Second Ring (Inside)
# 画第二个圆
mypie2, _ = ax.pie(subgroup_size, radius=1.3-0.3, labels=subgroup_names, labeldistance=0.7, colors=[a(0.5), a(0.4), a(0.3), b(0.5), b(0.4), c(0.6), c(0.5), c(0.4), c(0.3), c(0.2)],wedgeprops=dict(width=0.4, edgecolor='white'));

plt.margins(0,0);
饼图是一种图表,它生成一个全新的饼图,详细说明现有饼图的一小部分。它可用于减少混乱并强调一组特定的元素。
import matplotlib as mpl
import matplotlib.pyplot as plt
from matplotlib.patches import ConnectionPatch
# 使图表元素中正常显示中文
mpl.rcParams['font.sans-serif'] = 'SimHei'
# 使坐标轴刻度标签正常显示负号
mpl.rcParams['axes.unicode_minus'] = False

# 画布
fig = plt.figure(figsize=(12, 6),
#                  facecolor='cornsilk'
                )
ax1 = fig.add_subplot(121)
ax2 = fig.add_subplot(122)
fig.subplots_adjust(wspace=0)

# 定义数据
data = {'category': ['name1', 'name2', 'name3', 'name4', 'name5'],
        'quantity': [138, 181, 118, 107, 387]}

others = {'category': ['name1', 'name2', 'name3', ],
          'quantity': [98, 170, 119]}

# 大饼图
labs = data['category']
quantity = data['quantity']
explode = (0, 0, 0, 0, 0.03)    # 分裂距离

ax1.pie(x=quantity,
        colors=['r', 'g', 'm', 'c', 'y'],
        explode=explode, autopct='%1.1f%%',
        startangle=70, labels=labs,
        textprops={'color': 'k', 'fontsize': 12,})

# 小饼图
labs2 = others['category']
quantity_2 = others['quantity']

ax2.pie(x=quantity_2,
        colors=['khaki', 'olive', 'gold'],
        autopct='%1.1f%%', startangle=70,
        labels=labs2, radius=0.5,
        shadow=True, textprops={'color': 'k',
                   'fontsize': 12, }, )

# 用 ConnectionPatch 画出两个饼图的间连线
## 饼图边缘的数据
theta1 = ax1.patches[-1].theta1
theta2 = ax1.patches[-1].theta2
center = ax1.patches[-1].center
r = ax1.patches[-1].r

width=0.2
# 上边缘的连线
x = r*np.cos(np.pi/180*theta2)+center[0]
y = np.sin(np.pi/180*theta2)+center[1]
con_a = ConnectionPatch(xyA=(-width/2,0.5), xyB=(x,y),
                        coordsA='data', coordsB='data',
                        axesA=ax2, axesB=ax1 )

# 下边缘的连线
x = r*np.cos(np.pi/180*theta1)+center[0]
y = np.sin(np.pi/180*theta1)+center[1]
con_b = ConnectionPatch(xyA=(-width/2,-0.5),
                        xyB=(x,y), coordsA='data',
                        coordsB='data',  axesA=ax2,
                        axesB=ax1 )

for con in [con_a, con_b]:
    con.set_linewidth(1)    # 连线宽度
    con.set_color=([0,0,0]) # 连线颜色
    ax2.add_artist(con)     # 添加连线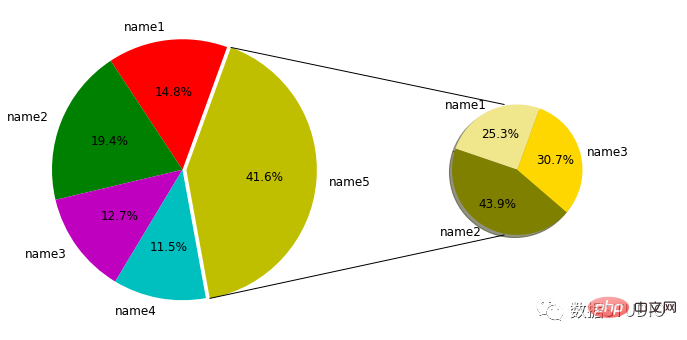
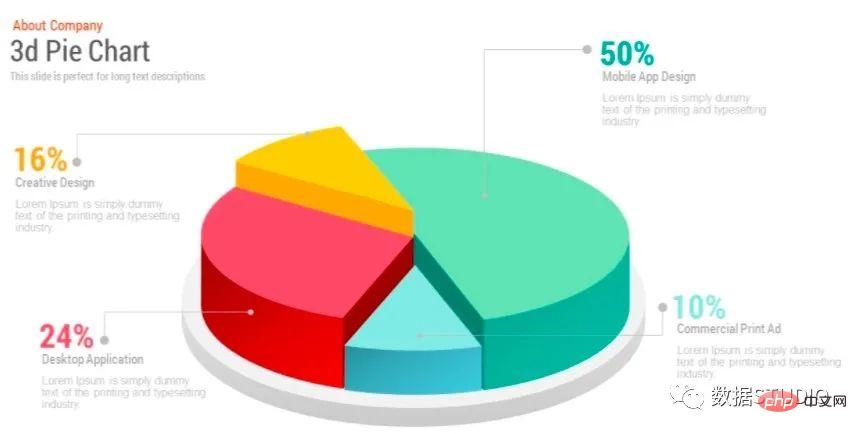
这是在 3 维空间中表示的饼图。
可以将 shadow 属性设置为 True 以在 seaborn / matplotlib 中执行此操作。
import matplotlib.pyplot as plt
labels = ['Python', 'C++', 'Ruby', 'Java']
sizes = [215, 130, 245, 210]
# Plot
plt.pie(sizes, labels=labels,
        autopct='%1.1f%%', shadow=True, startangle=140)
plt.axis('equal')
plt.show()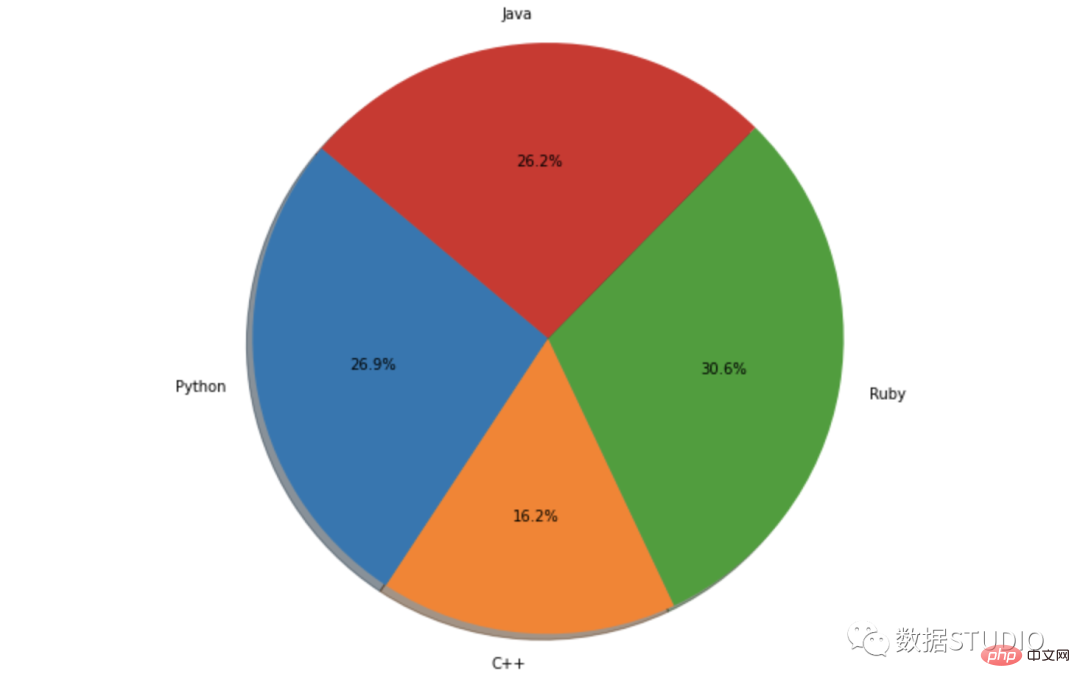
fig, ax = plt.subplots(figsize=(6, 6),
                       subplot_kw={'projection':'polar'})
data = 80
startangle = 90
x = (data * np.pi * 2)/ 100
left = (startangle * np.pi * 2) / 360 # 转换起始角度
ax.barh(1, x, left=left, height=1,
        color='#5DADE2')
plt.ylim(-3, 3)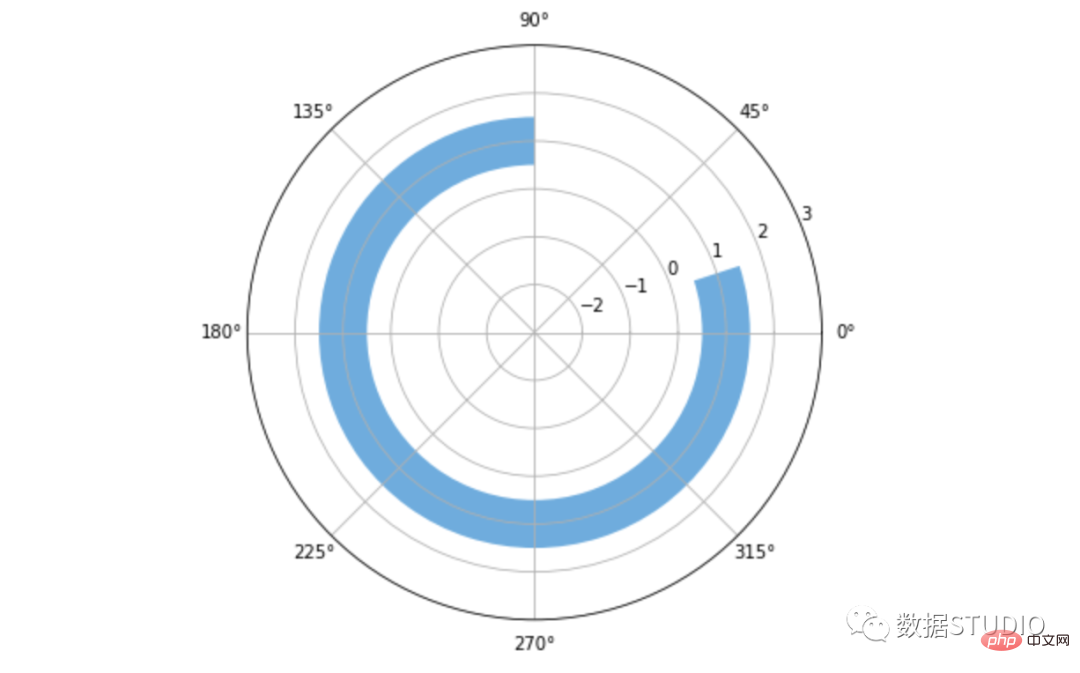
直方图是数值数据分布的近似表示。直方图,又称质量分布图,是一种统计报告图,由一系列高度不等的纵向条纹或线段表示数据分布的情况。
数据被划分为不重叠的区间,称为箱和桶。一个矩形竖立在一个 bin 上,其高度与 bin 中的数据点数量成正比。直方图给人一种底层数据分布密度的感觉。
适用: 直方图是以矩形的长度表示每一组的频数或数量,宽度则表示各组的组距,因此其高度与宽度均有意义,利于展示大量数据集的统计结果。
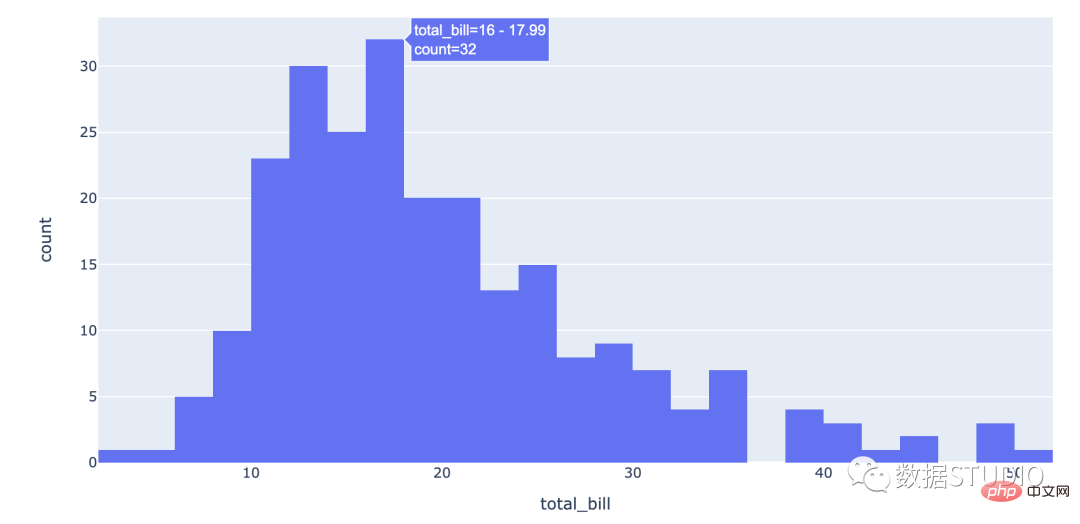
import plotly.express as px
df = px.data.tips()
fig = px.histogram(df, x="total_bill")
fig.show()
import seaborn as sns
sns.set_context({'figure.figsize':[12, 8]})
penguins = sns.load_dataset("penguins")
ax = sns.histplot(data=penguins, x="flipper_length_mm")
ax.xaxis.label.set_size(15)
ax.yaxis.label.set_size(15)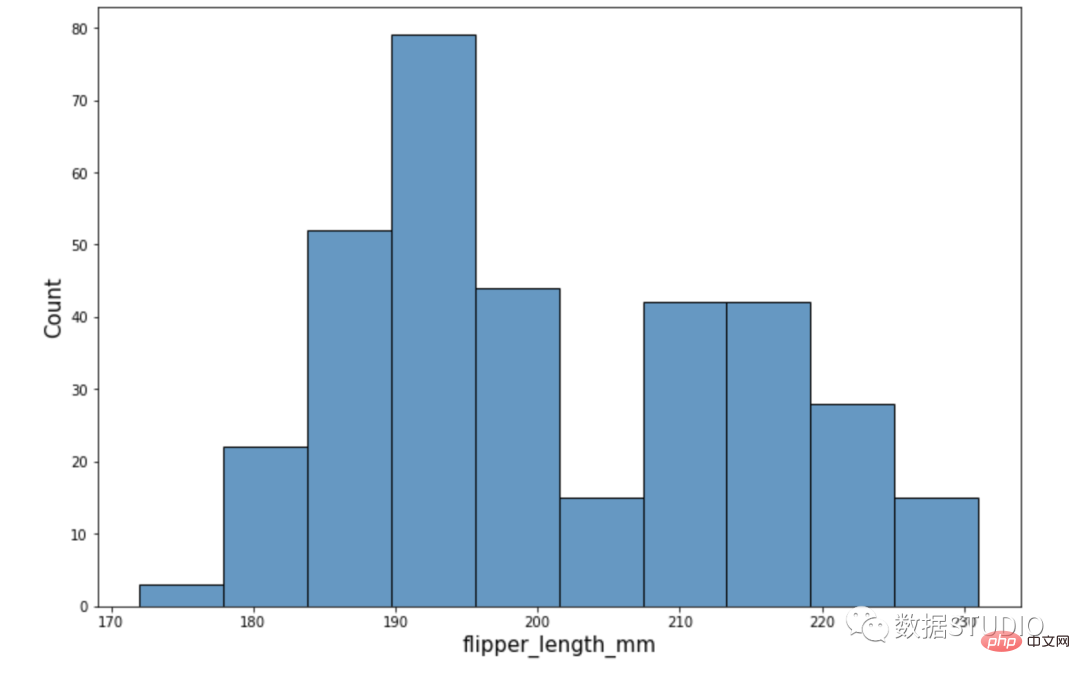
它根据其分布分为以下不同部分:
这个图表通常是钟形的。
在这个直方图中,有两组呈正态分布的直方图。它是在数据集中组合两个变量的结果。
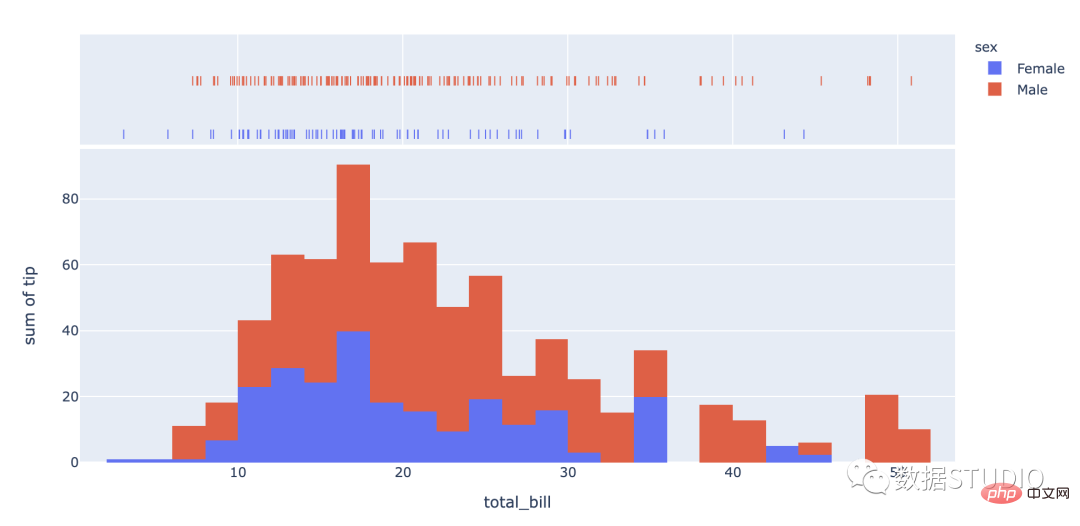
import plotly.express as px
df = px.data.tips()
fig = px.histogram(df, x="total_bill", y="tip",
                   color="sex", marginal="rug",
                   hover_data=df.columns)
fig.show()import seaborn as sns
iris = sns.load_dataset("iris")
sns.kdeplot(data=iris)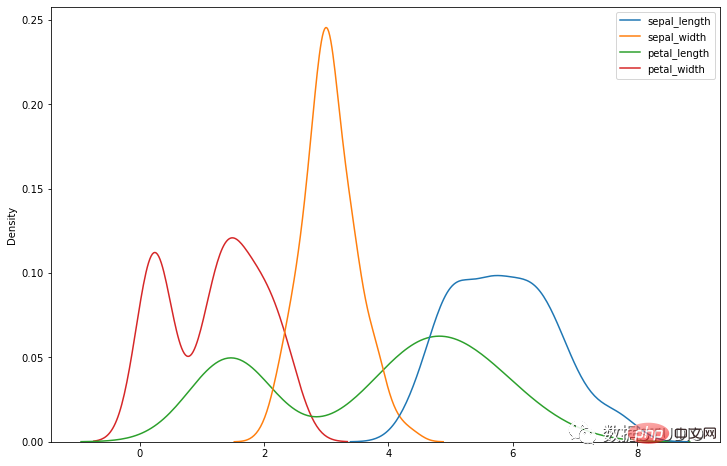
这是一个具有偏心峰的不对称图。峰值趋向于图形的开头或结尾。直方图可以说是右偏还是左偏,这取决于峰值趋向于哪个方向。
此直方图没有规则模式。它产生多个峰。它可以称为多峰分布。
这种分布类似于正态分布,除了在其一端有一个大峰。
梳状分布就像一个梳子。矩形条的高度高低交替。
它由线和轴之间的区域表示。面积与其代表的数量成正比。
这些是面积图的类型:
I在此图表中,彩色段彼此重叠。它们被放置在彼此之上。
在此图表中,彩色段彼此堆叠在一起。因此它们不相交。
在此图表中,每组数据所占的面积以占总数据量的百分比来衡量。通常,纵轴总计为 100%。
此图表是在 3 维空间上测量的。将在下面展示最常见类型的视觉表示和代码。
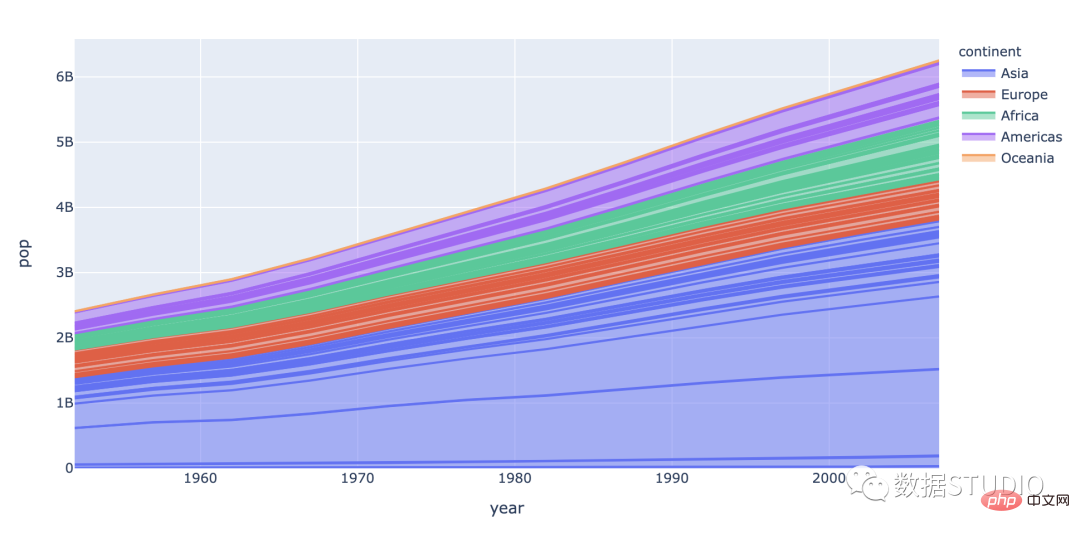
import plotly.express as px
df = px.data.gapminder()
fig = px.area(df, x="year", y="pop", color="continent",
       line_group="country")
fig.show()import pandas as pd
import matplotlib.pyplot as plt
import seaborn as sns
sns.set_context({'figure.figsize':[15, 8]})
sns.set_theme()
df = pd.DataFrame({'period': [1, 2, 3, 4, 5, 6, 7, 8],
'team_A': [20, 12, 15, 14, 19, 23, 25, 29],
'team_B': [5, 7, 7, 9, 12, 9, 9, 4],
'team_C': [11, 8, 10, 6, 6, 5, 9, 12]})
plt.stackplot(df.period, df.team_A, df.team_B, df.team_C)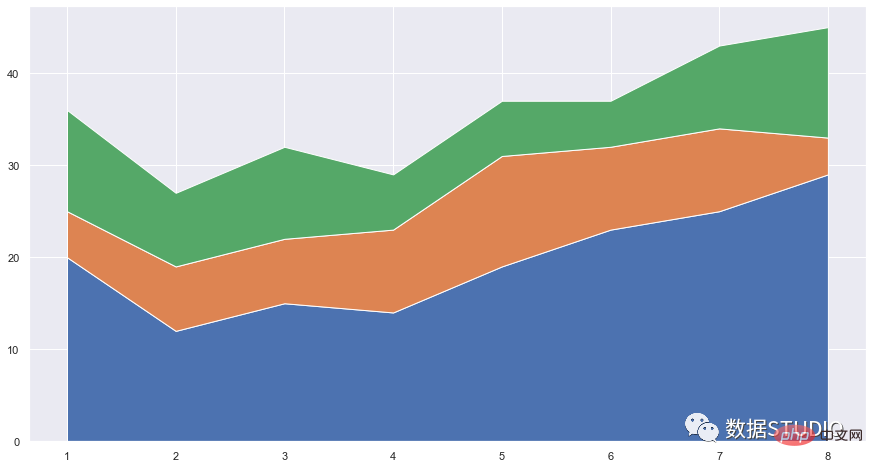
点图由在图形上绘制为点的数据点组成。
这些有两种类型:
在这个点图中,局部位移用于防止图上的点重叠。
这是一个类似散点图的图表,在一个维度中垂直显示数据。
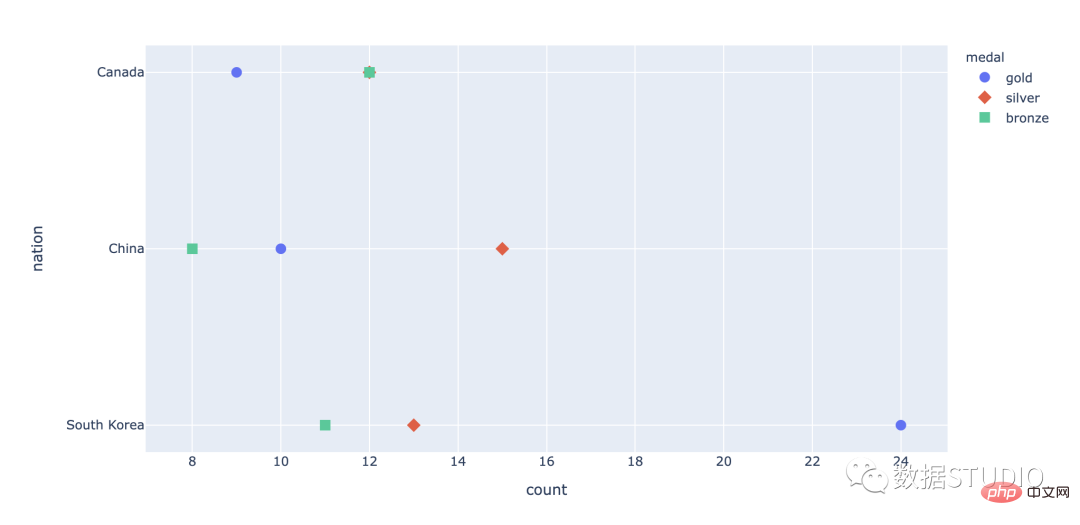
import plotly.express as px
df = px.data.medals_long()

fig = px.scatter(df, y="nation", x="count",
                 color="medal", symbol="medal")
fig.update_traces(marker_size=10)
fig.show()import seaborn as sns
sns.set_context({'figure.figsize':[15, 8]})
sns.set_theme(style="whitegrid")
tips = sns.load_dataset("tips")
ax = sns.stripplot(x="day",
y="total_bill", data=tips)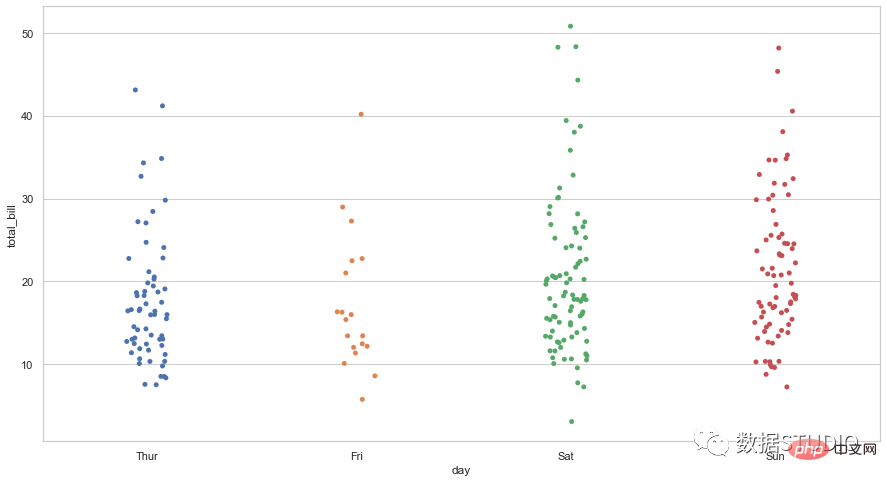
它是一种使用笛卡尔坐标显示一组数据的两个变量的值的图。它显示为点的集合。它们在水平轴上的位置决定了一个变量的值。垂直轴上的位置决定了另一个变量的值。当一个变量可以控制而另一个变量依赖于它时,可以使用散点图。当两个连续变量独立时也可以使用它。
散点图也叫 X-Y 图,它将所有的数据以点的形式展现在直角坐标系上,以显示变量之间的相互影响程度,点的位置由变量的数值决定。通过观察散点图上数据点的分布情况,我们可以推断出变量间的相关性;
适用: 适用于相关性分析,比如回归分析。
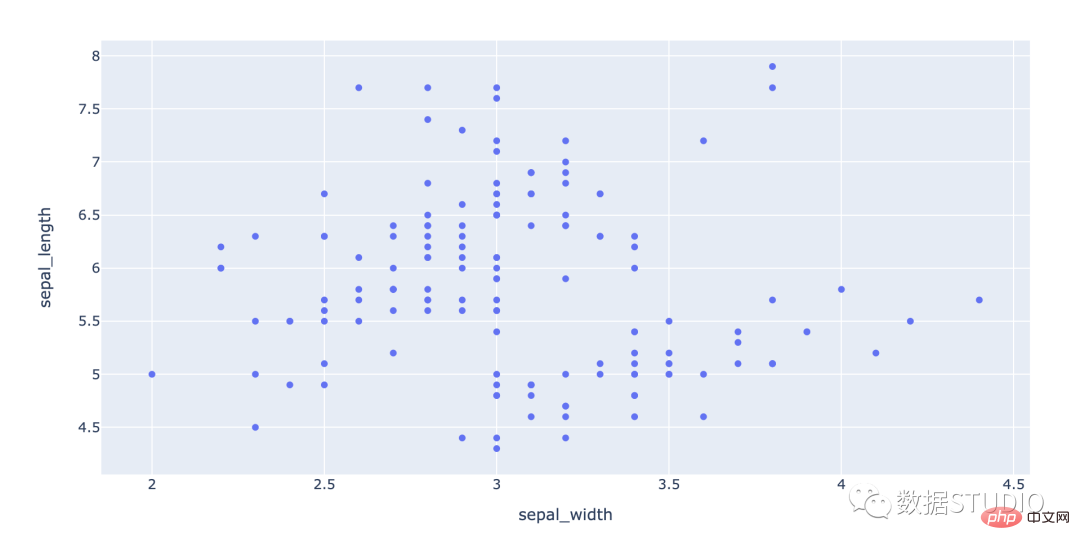
import plotly.express as px
df = px.data.iris() # iris is a pandas DataFrame
fig = px.scatter(df, x="sepal_width", y="sepal_length")
fig.show()
import seaborn as sns
tips = sns.load_dataset("tips")
sns.scatterplot(data=tips, x="total_bill", y="tip")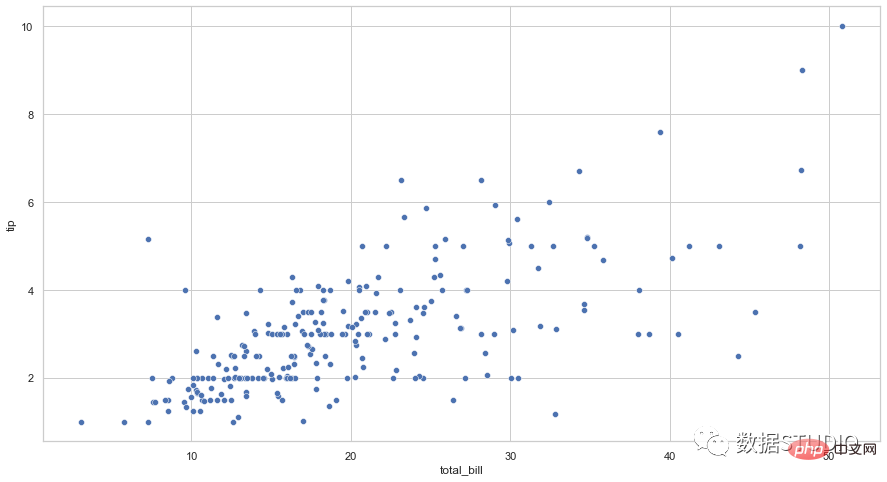
根据数据点的相关性,散点图分为不同的类型。下面列出了这些关联类型
#In these types of graphs, an increase in an independent variable indicates an increase in the variable that depends on it. Scatterplots can have high positive correlation or low positive correlation.
In these types of plots, an increase in an independent variable indicates the variables that are dependent on it reduce. Scatter plots can have high or low negative correlation.
If there is no obvious correlation between the two sets of data displayed on the scatter plot sex, they are considered irrelevant.
Bubble chart displays three attributes of the data. They are represented by the x position, y position and the size of the bubble. A bubble chart is a multivariate chart that is a variation of a scatter chart and can also be thought of as a combination of a scatter chart and a percentage area chart.
Applicable: Suitable for classification data comparison and correlation analysis.
Note: The data size and capacity of the bubble chart is limited. Too many bubbles will make the chart difficult to read. But it can be compensated by adding some interactive behaviors: hiding some information and displaying it when the mouse is clicked or hovered, or adding an option to reorganize or filter grouping categories. Additionally, bubble size is mapped to area rather than radius or diameter. Because if it is based on radius or diameter, the size of the circle will not only change exponentially, but also cause visual errors.
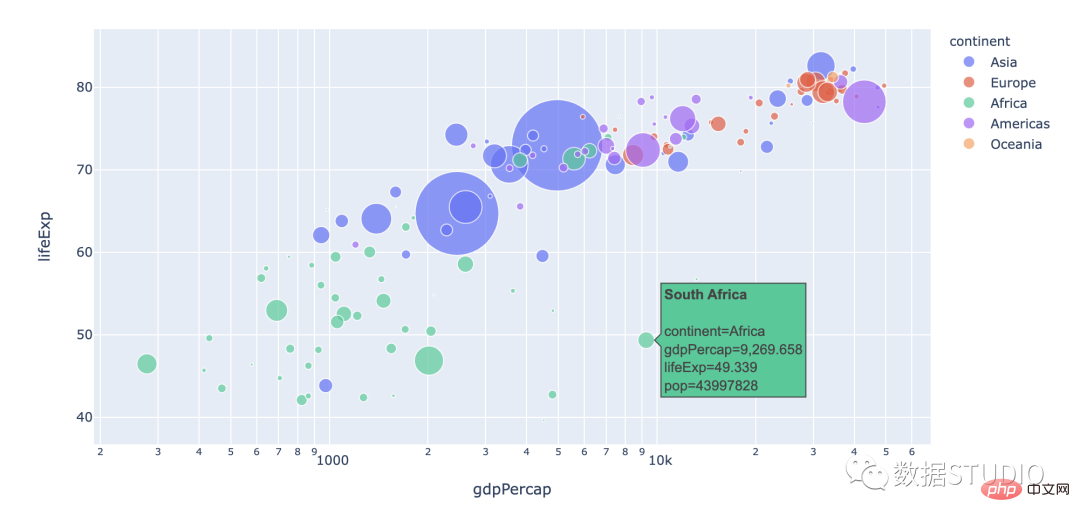
import plotly.express as px
df = px.data.gapminder()

fig = px.scatter(df.query("year==2007"), x="gdpPercap", y="lifeExp",
         size="pop", color="continent",
                 hover_name="country", log_x=True, size_max=60)
fig.show()import matplotlib.pyplot as plt
import seaborn as sns
from gapminder import gapminder # import data set
data = gapminder.loc[gapminder.year == 2007]
b = sns.scatterplot(data=data, x="gdpPercap",
y="lifeExp", size="pop",
legend=False, sizes=(20, 2000))
b.set(xscale="log")
plt.show()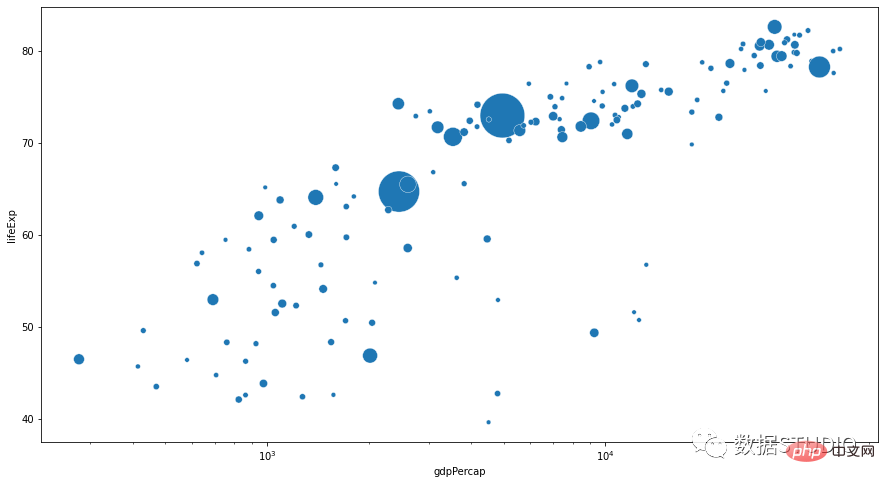
它们根据数据集中变量的数量、可视化数据的类型以及其中的维数将它们分为不同的类型。
它是气泡图的基本类型,相当于普通气泡图。
此气泡图上的气泡已标记,以便于识别。这是为了处理不同的数据组。
此图表有四个数据集变量。第四个变量用不同的颜色区分。
它用于说明地图上的数据。
这是在 3 维空间中设计的气泡图。这里的气泡是球形的。
它是一个图形显示数据,由许多自变量组成。它显示为三个或更多定量变量的二维图表。这些变量显示在从同一点开始的轴上。
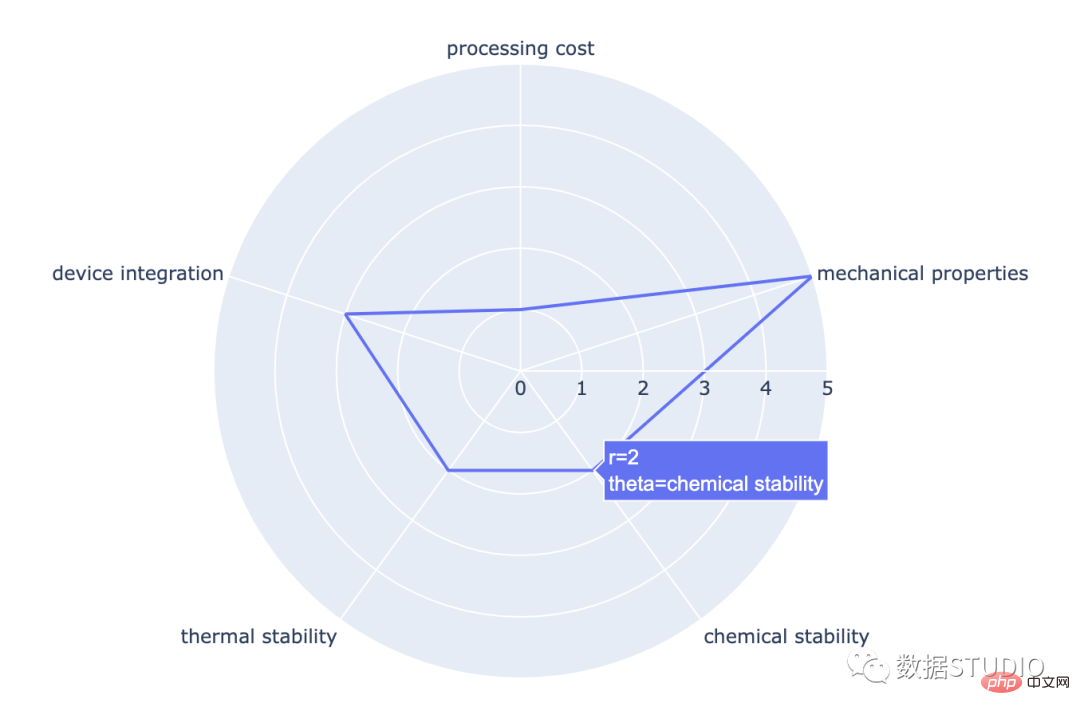
import plotly.express as px
import pandas as pd
df = pd.DataFrame(dict(
    r=[1, 5, 2, 2, 3],
    theta=['processing cost','mechanical properties',
           'chemical stability',
           'thermal stability', 'device integration']))
fig = px.line_polar(df, r='r', theta='theta', line_close=True)
fig.show()import pandas as pd
import seaborn as sns
import numpy as np
import matplotlib.pyplot as plt
stats=np.array([1, 5, 2, 2, 3])
labels=['processing cost','mechanical properties','chemical stability',
'thermal stability', 'device integration']
angles=np.linspace(0, 2*np.pi, len(labels), endpoint=False)
fig=plt.figure()
ax = fig.add_subplot(111, polar=True)
ax.plot(angles, stats, 'o-', linewidth=2)
ax.fill(angles, stats, alpha=0.25)
ax.set_thetagrids(angles * 180/np.pi, labels)
ax.set_title("Radar Chart")
ax.grid(True)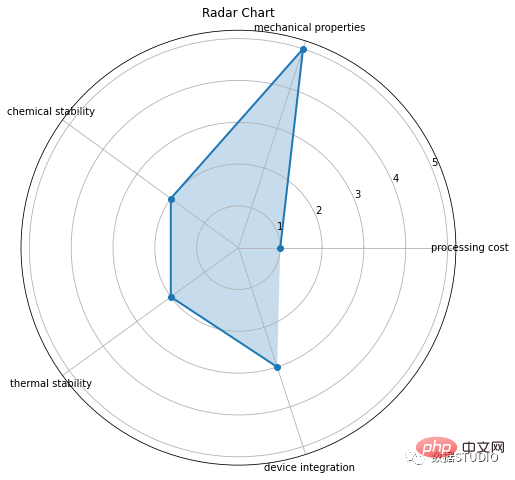
这是雷达图的基本类型。它由从中心点绘制的几个半径组成。
在这些中,蜘蛛图上的每个数据点都被标记。
在填充的雷达图中,线条和蜘蛛网中心之间的空间是彩色的。
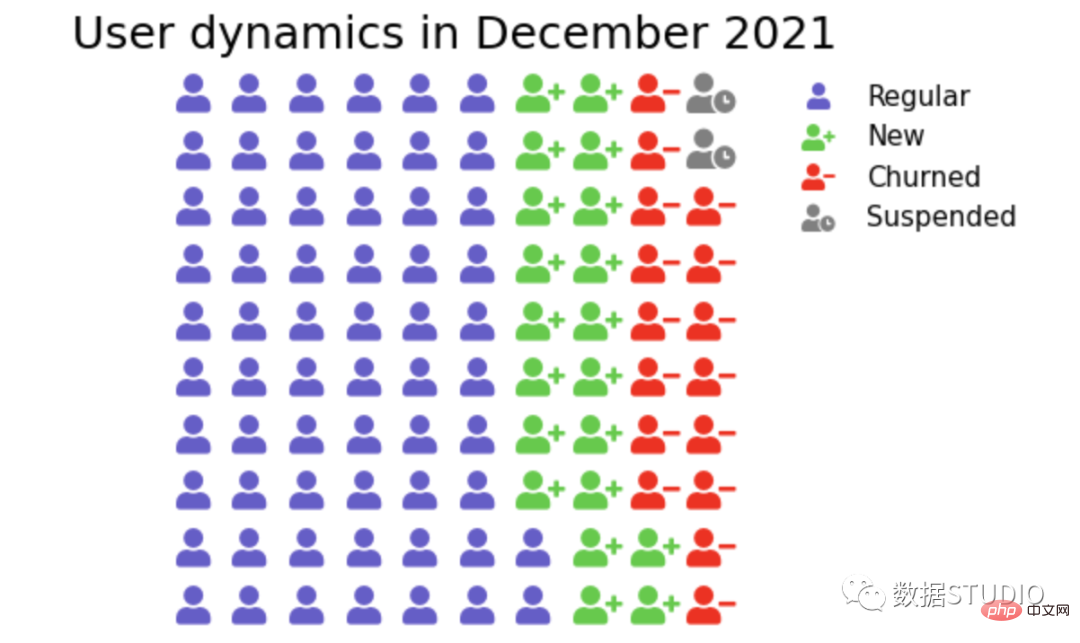
它使用图标来提供一小组离散数据的更具吸引力的整体视图。图标代表基础数据的主题或类别。例如,人口数据将使用人的图标。每个图标可以代表一个或多个(例如一百万)个单位。数据的并排比较在图标的列或行中完成。这是为了将每个类别相互比较。
在 plotly 中,标记符号可以与 graph_objs Scatter 一起使用。
import plotly.graph_objs as go
from plotly.offline import iplot, init_notebook_mode
init_notebook_mode()
from IPython.display import display,HTML
import pandas as pd

title = 'Team scores'

ds = pd.Series({'Alpha' : 67, 'Bravo' : 30, 'Charlie' : 20, 'Delta': 12, 'Echo': 23, 'Foxtrot': 56})

print(sum(ds))

Xlim = 16
Ylim = 13
Xpos = 0
Ypos = 12 ##change to zero for upwards
series = []
for name, count in ds.iteritems():
    x = []
    y = []
    for j in range(0, count):
        if Xpos == Xlim:
            Xpos = 0
            Ypos -= 1 ##change to positive for upwards
        x.append(Xpos)
        y.append(Ypos)
        Xpos += 1
    series.append(go.Scatter(x=x, y=y, mode='markers', marker={'symbol': 'square', 'size': 15}, name=f'{name} ({count})'))


fig = go.Figure(dict(data=series, layout=go.Layout(
    title={'text': title, 'x': 0.5, 'xanchor': 'center'},
    paper_bgcolor='rgba(255,255,255,1)',
    plot_bgcolor='rgba(0,0,0,0)',
    xaxis=dict(showgrid=False,zeroline= False, showline=False, visible=False, showticklabels=False),
    yaxis=dict(showgrid=False,zeroline= False, showline=False, visible=False, showticklabels=False),
)))
fig.show()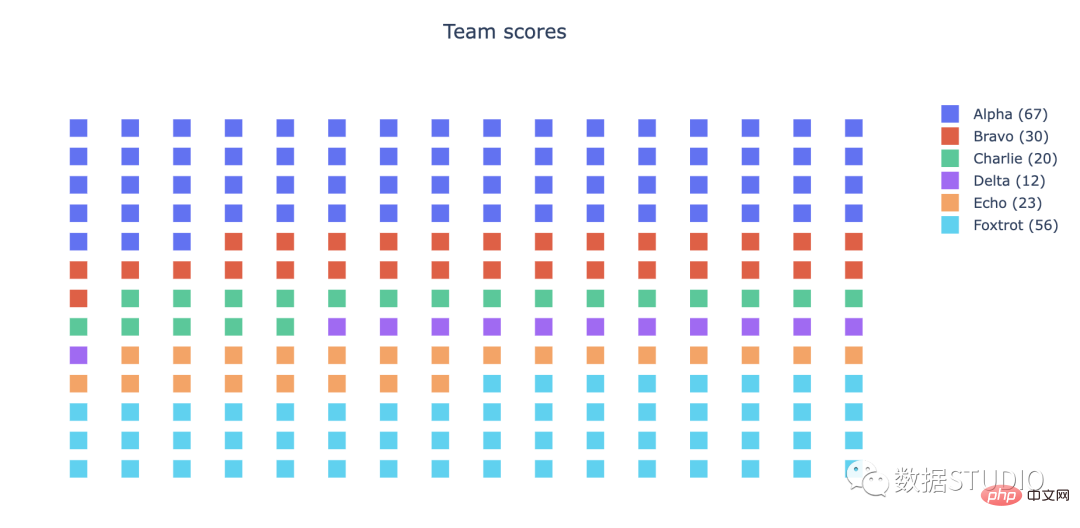
在 matplotlib 的 figure 方法中可以使用图标属性。
from pywaffle import Waffle
import matplotlib.pyplot as plt
plt.figure(figsize=(15,8))
dict_users = {'Regular': 62, 'New': 20, 'Churned': 16, 'Suspended': 2}
df = pd.Series(dict_users)
colors_list = ['slateblue', 'limegreen', 'red', 'grey']
colors = {df.index[i]:colors_list[i] for i in range(len(df))}

fig = plt.figure(FigureClass=Waffle,
                 figsize=(10,5),
                 values=dict_users,
                 rows=10,
                 colors=list(colors.values()),
                 icons=['user','user-plus', 'user-minus', 'user-clock'],
                 font_size=22,
                 icon_legend=True,
                 legend={'bbox_to_anchor': (1.55, 1), 'fontsize': 15, 'frameon': False})
plt.title('User dynamics in December 2021', fontsize=25)
plt.show()样条图是折线图的一种。它将系列中的每个数据点与表示缺失数据点的粗略近似值的拟合曲线连接起来。
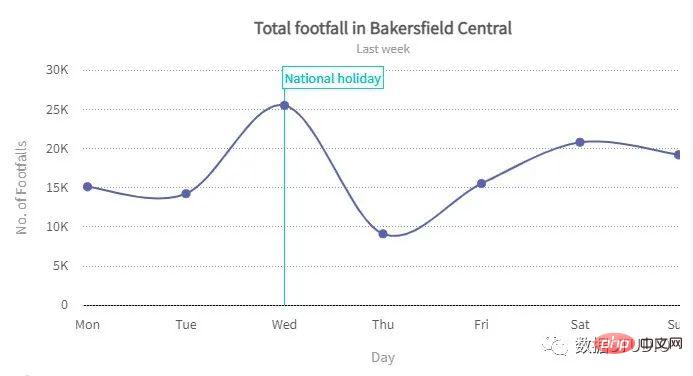
在 plotly 中,它是通过将 line_shape 指定为 spline 来实现的。
import plotly.express as px
df = px.data.gapminder().query("country=='Canada'")
fig = px.line(df, x="year", y="lifeExp",
              title='Life expectancy in Canada',
              line_shape = 'spline')
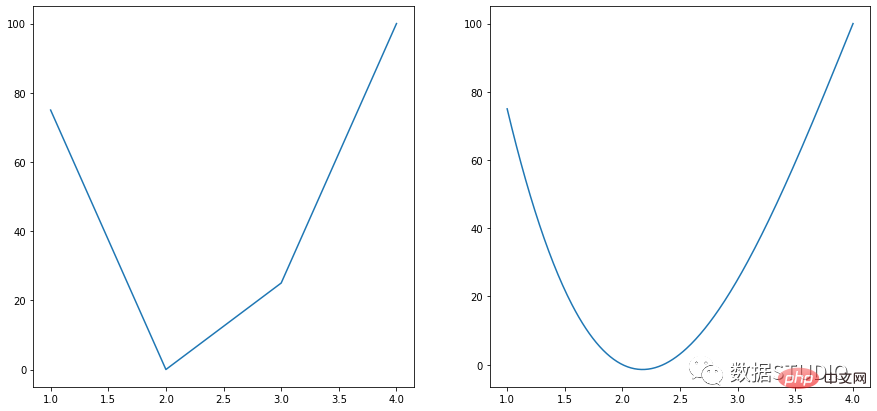
fig.show()Scipy 插值和 NumPy linspace 可用于在 matplotlib 中实现这一点。
from scipy import interpolate
import numpy as np
import matplotlib.pyplot as plt
fig, ax = plt.subplots(1,2,figsize=(15,7))
x = np.array([1, 2, 3, 4])
y = np.array([75, 0, 25, 100])
ax[0].plot(x, y)

x_new = np.linspace(1, 4, 300)
a_BSpline = interpolate.make_interp_spline(x, y)
y_new = a_BSpline(x_new)

ax[1].plot(x_new, y_new)
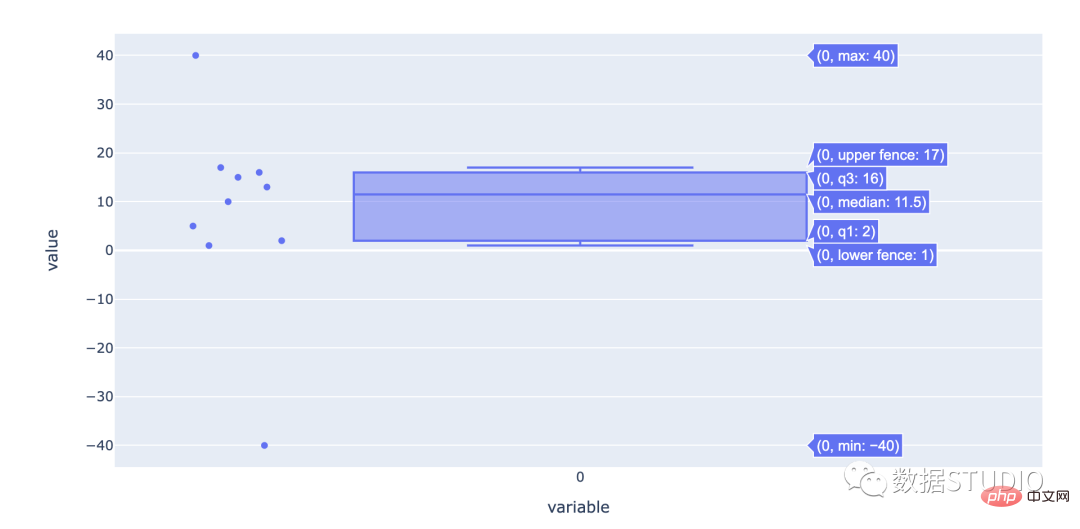
箱线图是查看数据分布方式的好方法。
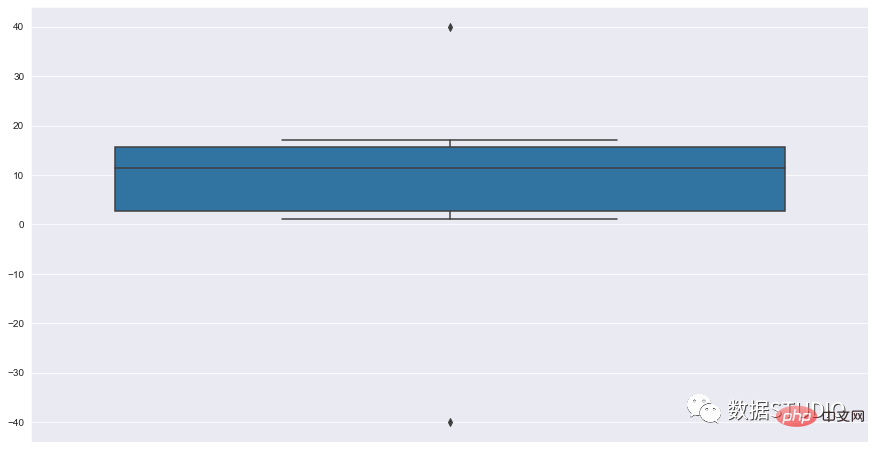
顾名思义,它有一个盒子。盒子的一端位于数据的第 25个百分位。第25个百分位数是绘制的线,其中 25% 的数据点位于其下方。盒子的另一端位于第 75个百分位数(其定义类似于第 25个百分位数)百分位如上)。数据的中位数由一条线标记。还有两条额外的线,称为须线。
第 25 个百分位标记称为“Q1”(代表数据的第一季度)。第 75 个百分点是 Q3。Q3 和 Q1 (Q3 – Q1) 之间的差异是 IQR(四分位距)。在 Q1 – 1.5 * IQR 和 Q3 + 1.5 * IQR的极端范围内任一侧的最后数据点处标记了晶须。这些须线之外的数据点被称为“异常值”,因为它们与其余数据点有显着差异。
箱形图又称盒须图、盒式图或箱线图,是利用数据中的五个统计量:最小值、第一四分位数、中位数、第三四分位数与最大值来显示一组数据分布情况的统计图。
适用: 适用于展示一组数据分散情况,特别用于对几个样本的比较。
import numpy as np
import plotly.express as px
data = np.array([-40,1,2,5,10,13,15,16,17,40])
fig = px.box(data, points="all")
fig.show()
import seaborn as sns
sns.set_style( 'darkgrid' )
fig = sns.boxplot(y=data)
箱线图有助于理解数据的整体分布,即使是大型数据集也是如此。
一般来说,小提琴图是一种绘制连续型数据的方法,可以认为是箱形图与核密度图的结合体。当然了,在小提琴图中,我们可以获取与箱形图中相同的信息。
import plotly.express as px
df = px.data.tips()
fig = px.violin(df, y="total_bill", x="day",
                color="sex", box=True, points="all",
          hover_data=df.columns)
fig.show()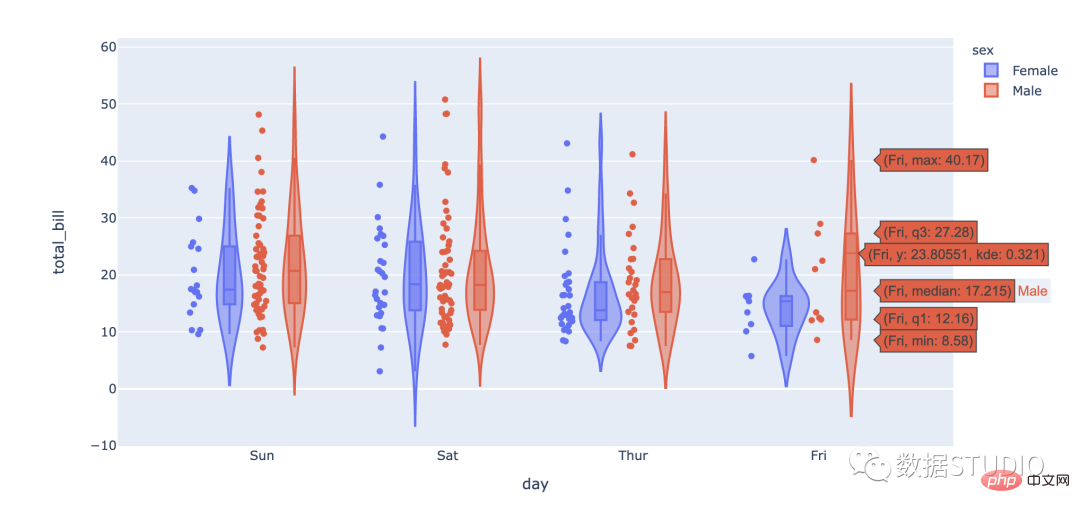
import seaborn as sns
sns.set_context({'figure.figsize':[15, 8]})
sns.set_theme(style="whitegrid")
tips = sns.load_dataset("tips")
ax = sns.violinplot(x="day", y="total_bill", hue="sex", data=tips)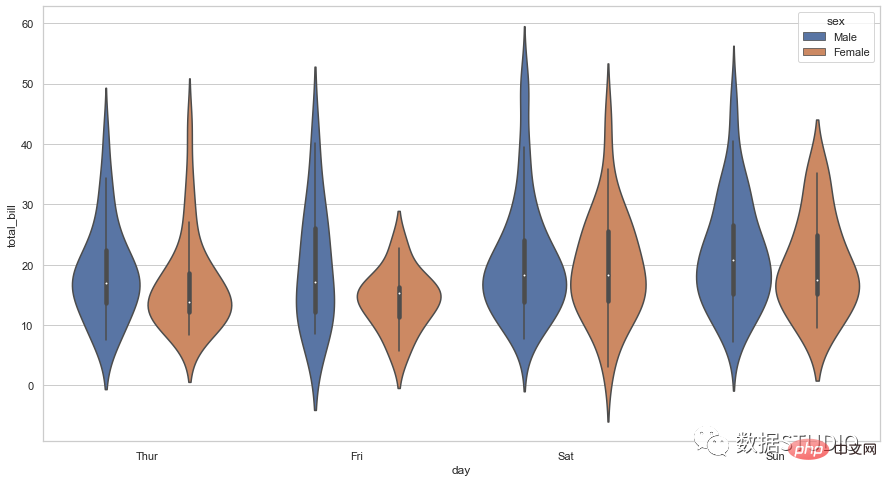
import numpy as np
import matplotlib.pyplot as plt
import seaborn as sns
N = 10**4
x = np.random.normal(size=N)
fig, ax = plt.subplots(3, 1,figsize=(15,8), sharex=True)
sns.distplot(x, ax=ax[0])
ax[0].set_title('Histogram + KDE')
sns.boxplot(x, ax=ax[1])
ax[1].set_title('Boxplot')
sns.violinplot(x, ax=ax[2])
ax[2].set_title('Violin plot')
fig.suptitle('Standard Normal Distribution', fontsize=16)
plt.show()
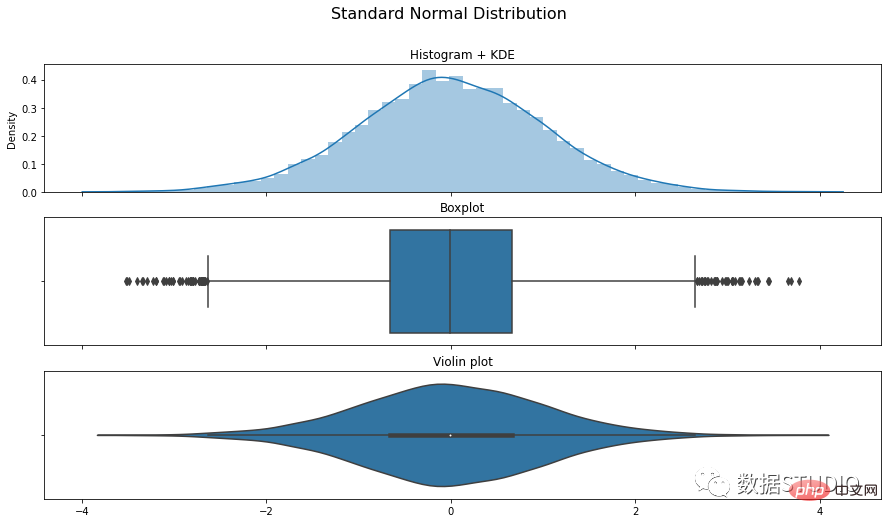
这是用于生成这些图的 plotly 和 seaborn 中方法和属性的备忘单。
| Plot type | plotly | seaborn |
|---|---|---|
| Simple bar graph | express bar | barplot |
| Grouped bar graph | color attribute and barmode=’group’ | hue attribute |
| Stacked bar graph | color attribute | label and color attributes with multiple plots |
| Simple line graph | express line | lineplot |
| Multiple line graph | color and symbol attributes | hue attribute |
| Simple pie chart | express pie | matplotlib.pyplot.pie |
| Exploded pie chart | graph_objects Pie with pull attribute | explode attribute |
| Donut chart | graph_objects Pie with hole attribute | Add matplotlib.pyplot.Circle |
| 3D pie chart | Use pygooglechart package | shadow attribute |
| Normal histogram | express histogram | histplot |
| Bimodal histogram | color attribute | kdeplot |
| Area chart | express area | matplotlib.pyplot.stackplot |
| Dot graph | express scatter | stripplot |
| Scatter plot | express scatter | scatterplot |
| Bubble chart | express scatter with color and size attributes | scatterplot with size attribute |
| Radar chart | express line_polar | matplotlib.pyplot figure |
| Pictogram | graph_objects Figure having Scatter with marker attribute | matplotlib.pyplot figure with pywaffle package |
| Spline chart | express line with line_shape=’spline’ | Scipy.interpolate.make_interp_spline |
| Box plot | express box | boxplot |
| Violin Plot | express violin | violinplot |
The above is the detailed content of Tips | The 14 most commonly used data visualization types of code in Python. For more information, please follow other related articles on the PHP Chinese website!


