Home > Backend Development > Python Tutorial > Python College Entrance Examination | matplotlib plots the admission rates of Qingbei, 985 universities, and 211 universities in various regions across the country

Python College Entrance Examination | matplotlib plots the admission rates of Qingbei, 985 universities, and 211 universities in various regions across the country

Release: 2023-08-08 17:20:50
forward
1168 people have browsed it


This issue is based on the admission rate data of Qingbei, 985 colleges and 211 colleges and universities in various regions across the country , uses python’s matplotlib library Draw the corresponding distribution map , I hope it will be helpful to everyone, If you have any questions or areas that need improvement, please contact the editor.

##1. Admission rate of 985 colleges and universities in various regions across the country

##
df_985 = pd.read_excel('./985高校录取率.xlsx')
Copy after login
Python College Entrance Examination | matplotlib plots the admission rates of Qingbei, 985 universities, and 211 universities in various regions across the country
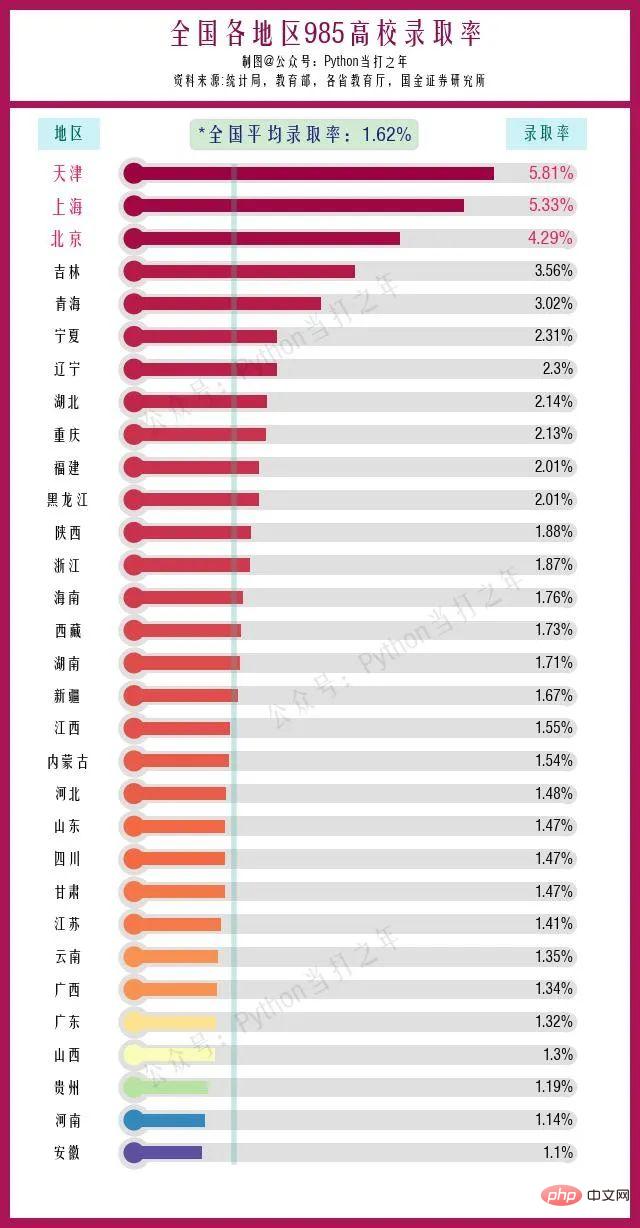
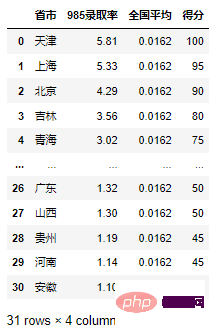
  • # Tianjin ranked first with an acceptance rate of 5.81%.
  • Shanghai and Beijing ranked second and third with admission rates of 5.33% and 4.29% respectively.

  • There are
    17 areas where the acceptance rate exceeds the average of 1.62%.

2. 全国各地区211高校录取率

df_211 = pd.read_excel('./211高校录取率.xlsx')
Copy after login
Python College Entrance Examination | matplotlib plots the admission rates of Qingbei, 985 universities, and 211 universities in various regions across the country
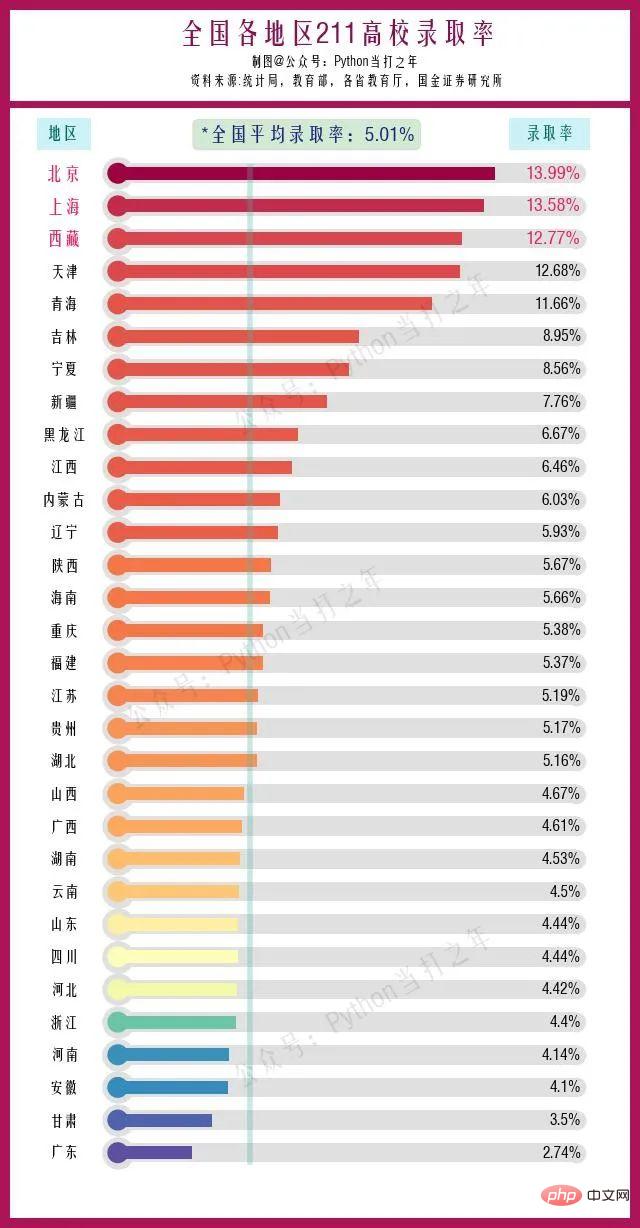
  • 北京以13.99%的录取率排名第一。
  • 上海、西藏、天津、青海分列第二至五位,其中西藏、青海两地考生基数相对较少,2023年西藏大约0.89万考生,青海大约 4.84万考生。

  • 19个地区录取率在全过均线5.01%以上。


3. 全国各地区清北录取率

df_qb = pd.read_excel('./清北录取率.xlsx')
Copy after login
Python College Entrance Examination | matplotlib plots the admission rates of Qingbei, 985 universities, and 211 universities in various regions across the country
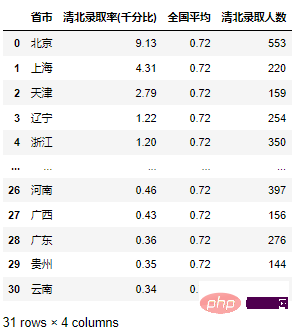
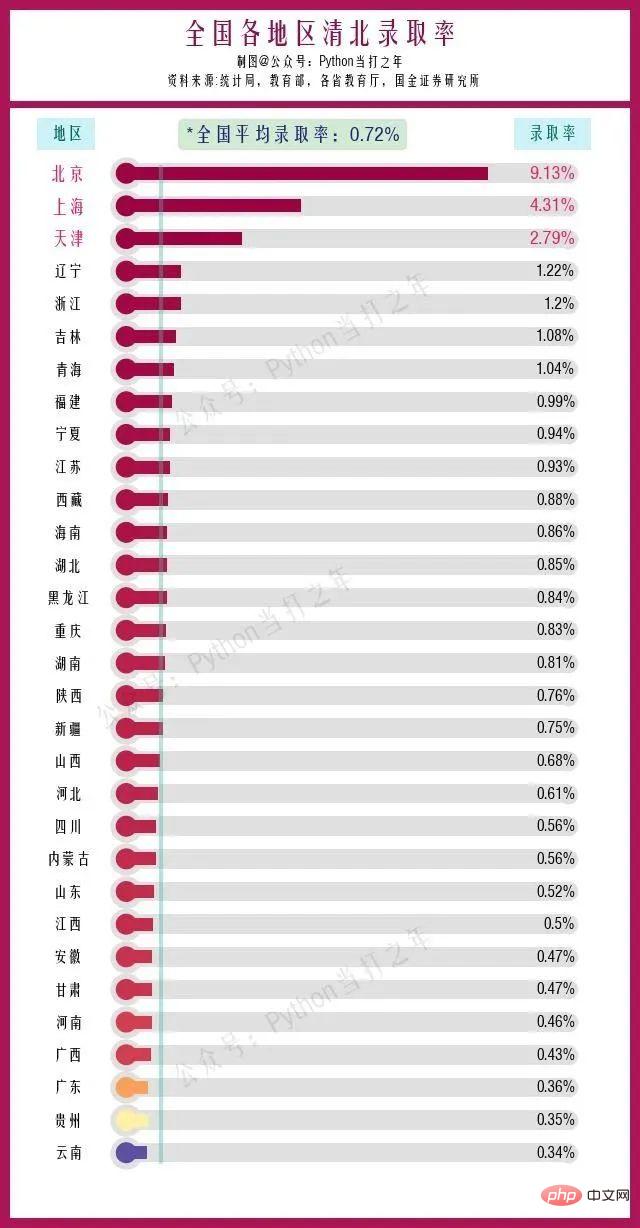
  • 北京以9.13%的录取率排名第一,远高于其他地区。
  • 上海、、天津、辽宁、浙江分列第二至五位。

  • 18个地区录取率在全过均线0.72%以上。

The above is the detailed content of Python College Entrance Examination | matplotlib plots the admission rates of Qingbei, 985 universities, and 211 universities in various regions across the country. For more information, please follow other related articles on the PHP Chinese website!

Related labels:
source:Python当打之年
Statement of this Website
The content of this article is voluntarily contributed by netizens, and the copyright belongs to the original author. This site does not assume corresponding legal responsibility. If you find any content suspected of plagiarism or infringement, please contact admin@php.cn
Popular Tutorials
More>
Latest Downloads
More>
Web Effects
Website Source Code
Website Materials
Front End Template