
How to debug React source code? The following article will talk about how to debug React source code under various tools, and introduce how to debug the real source code of React in contributors, create-react-app, and vite projects. I hope it will be helpful to everyone!
CloneReactlocally and install dependencies.
git clone https://github.com/facebook/react.git
If you just run a simpleyarn build, the sourcemap will not be generated. This is not what we want. We need to compile thesourcemap## required by the modern editor. #Map to actual source code for debugging.
scripts/rollup/build.js[Recommended learning:vscode tutorial,Programming Teaching】
②: The comment part cannot generate the sourcemap plug-in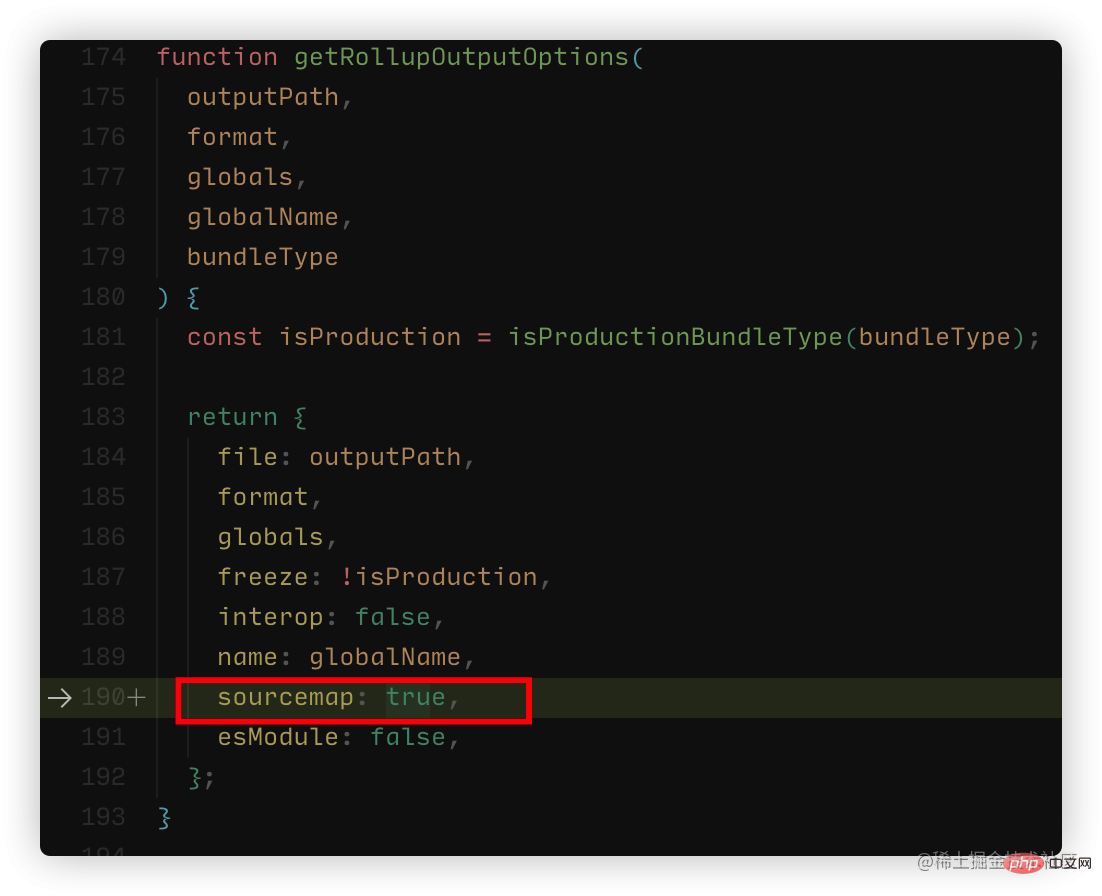

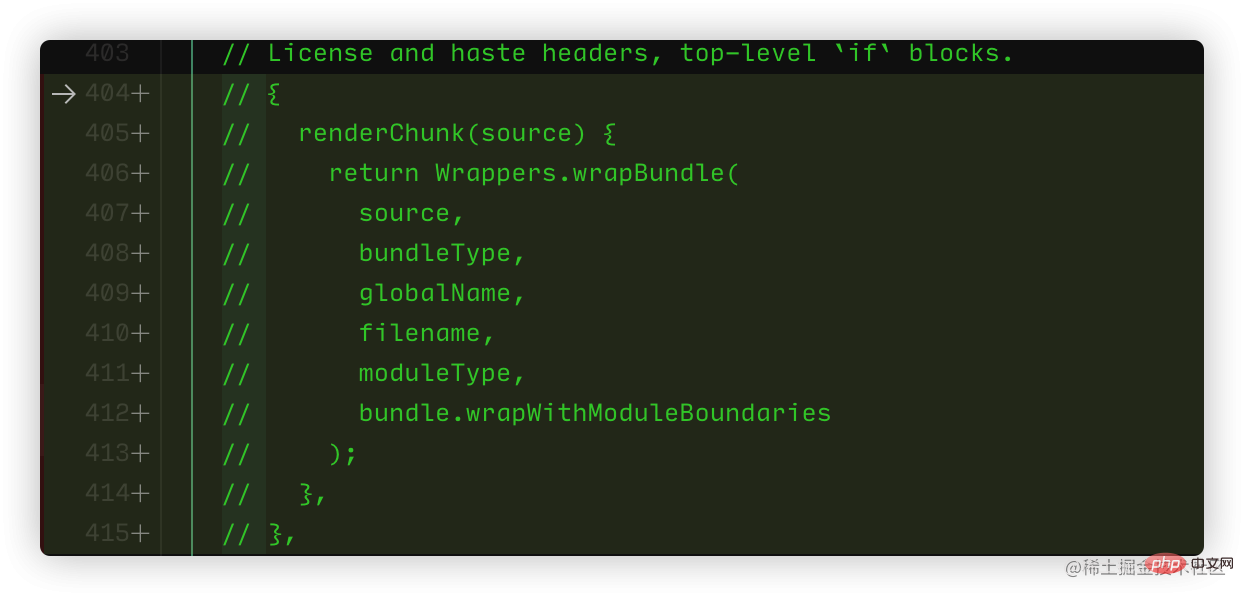
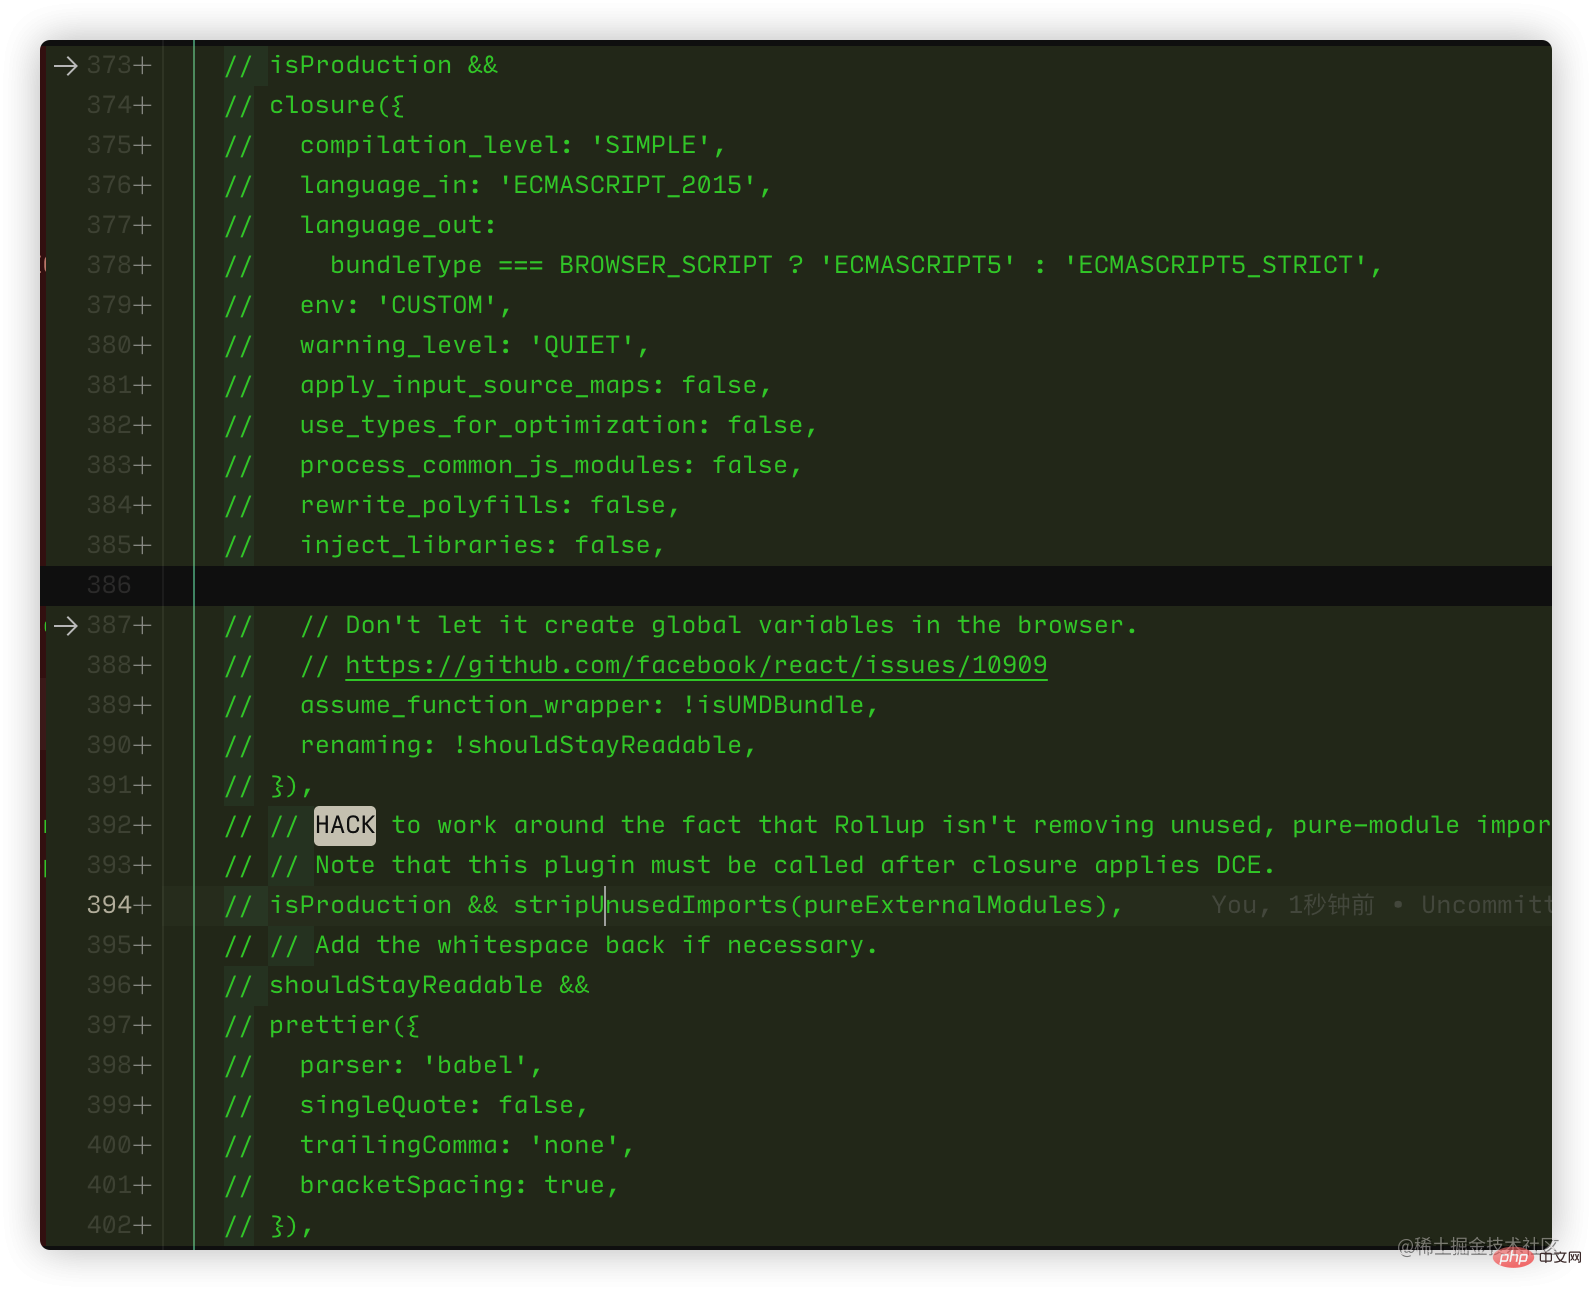 ok , it looks like a lot, but in fact they are all roughly connected together (353-355, 387-415). Several plug-ins have been commented out. At this time we can build
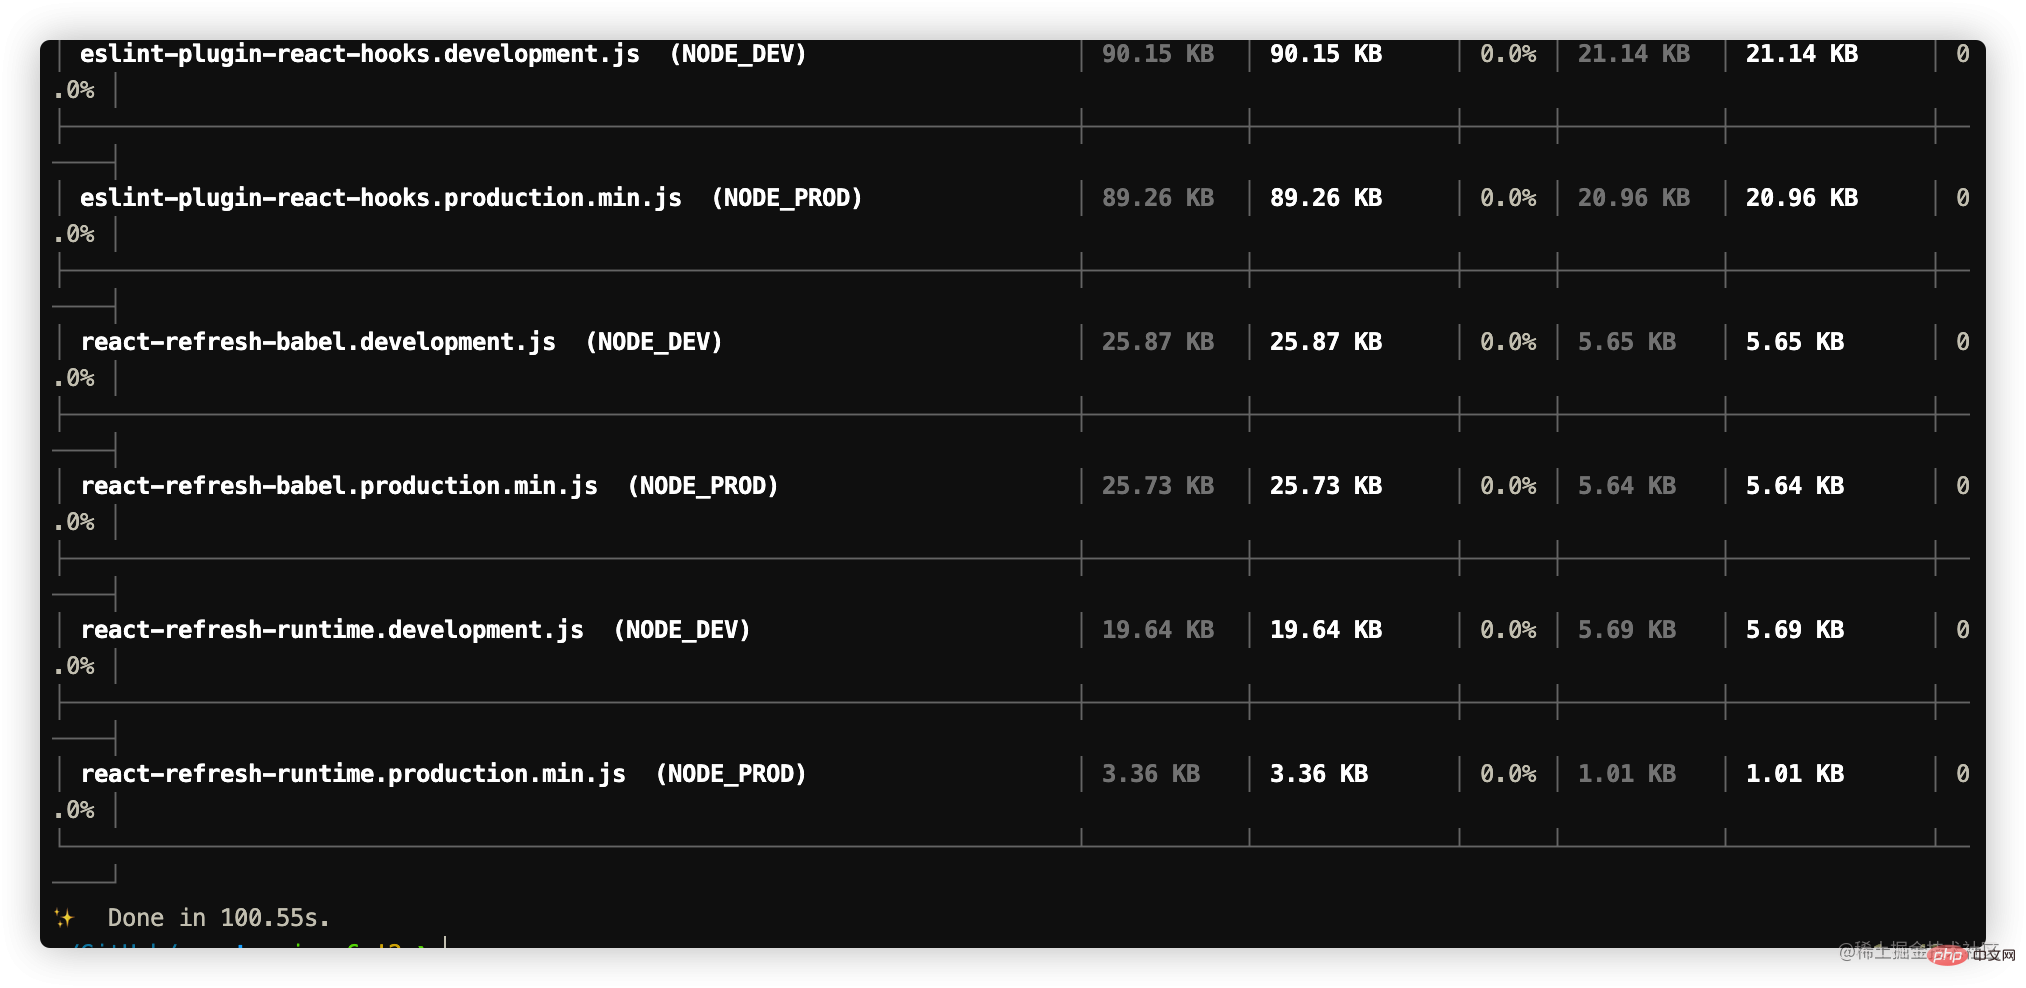
yarn build
Note: If build If it fails, you will be prompted to install jdk. Just install it according to the error message.The successful results are as follows:
Official DocumentWe learned that the basic development file directory is in/fixtures/packaging/babel-standalone/dev.html, so we first performed a simple debug configuration based on the html.
launch.json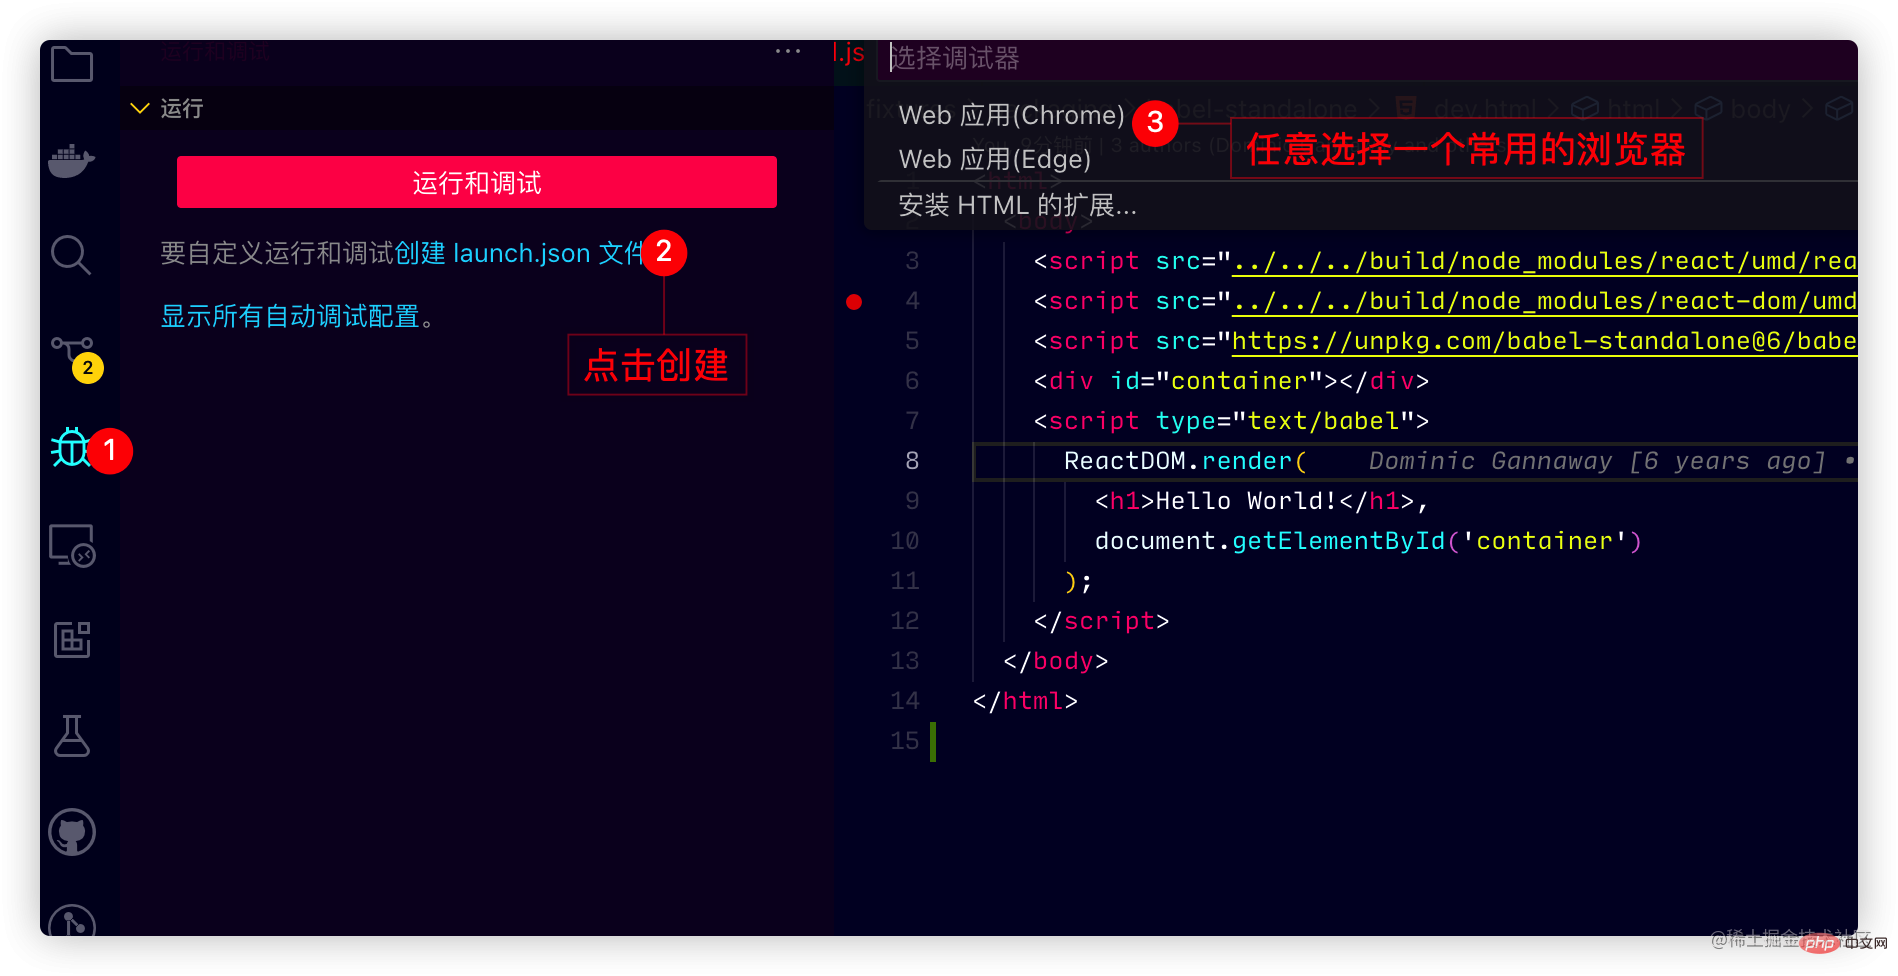
launch.jsonConfiguration
{ // 使用 IntelliSense 了解相关属性。 // 悬停以查看现有属性的描述。 // 欲了解更多信息,请访问: https://go.microsoft.com/fwlink/?linkid=830387 "version": "0.2.0", "configurations": [ { "type": "chrome", "request": "launch", "name": "Open dev.html", // 这里路径可能不一样 做统一调整 修改为如下 "file": "${workspaceFolder}/fixtures/packaging/babel-standalone/dev.html" } ] }
Note: We already have the sourcemap at this time, directly In/packages/react-dom
or/packages/react, the code will run until the breakpoint is set
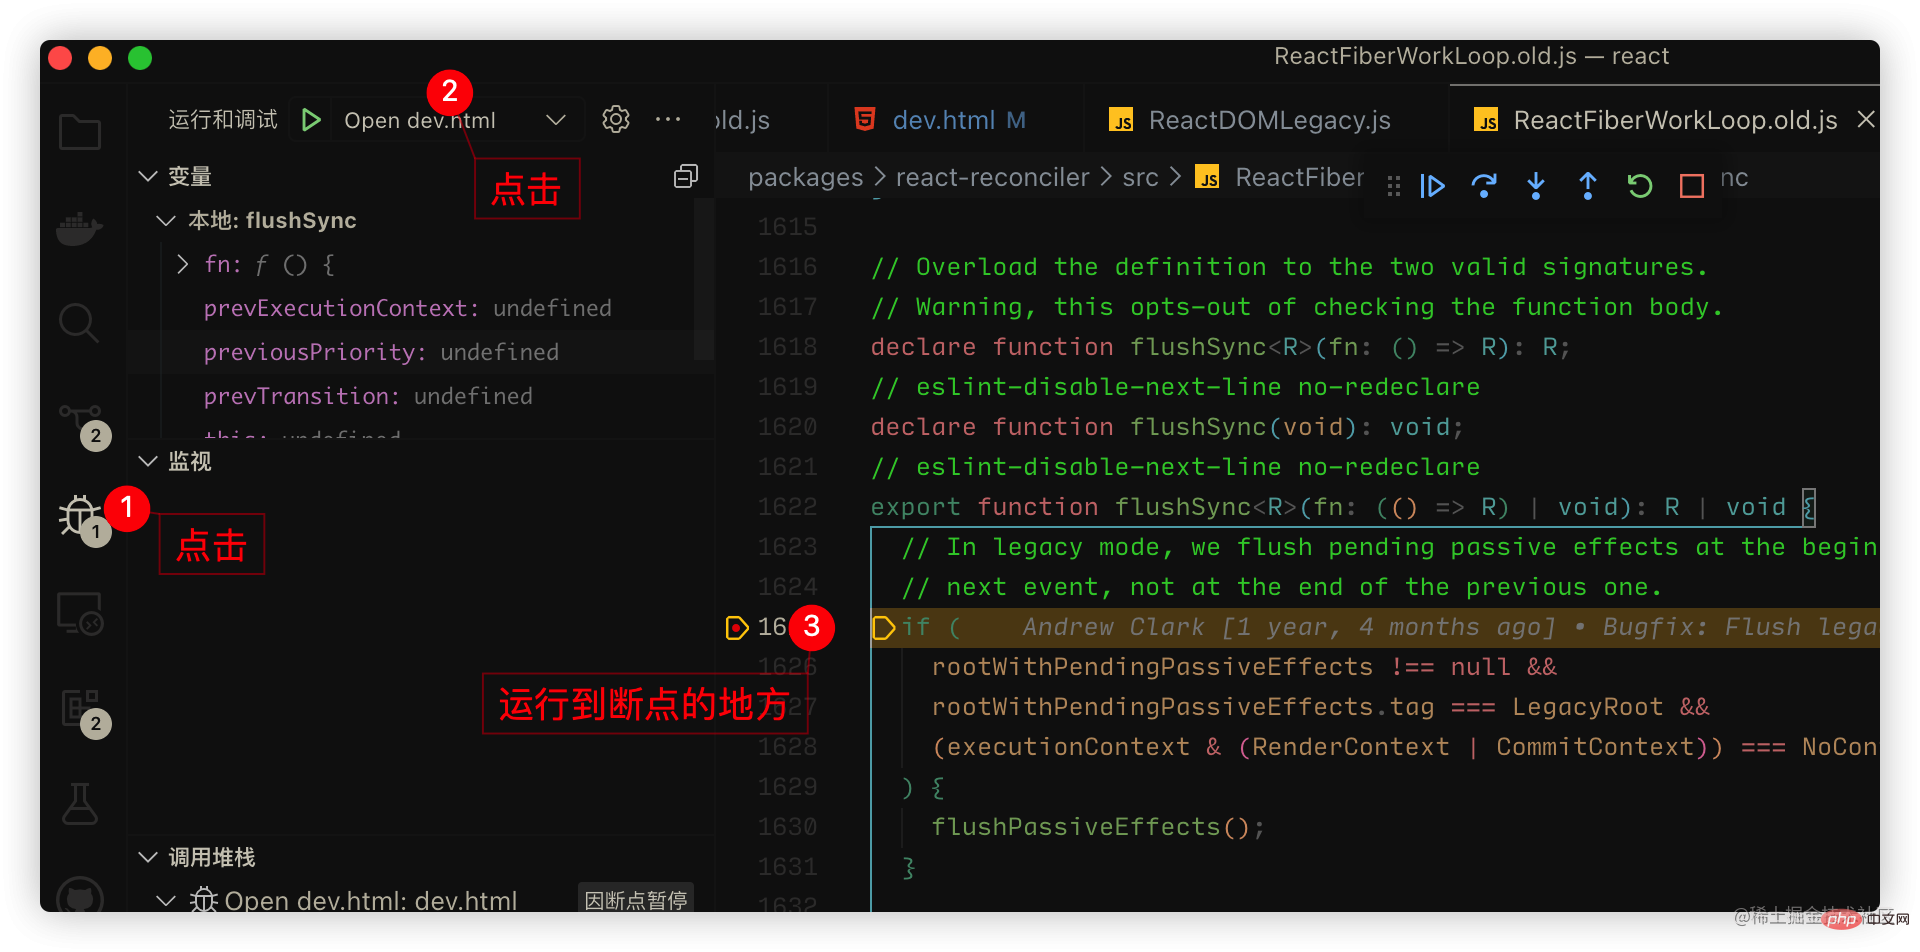
dev.html: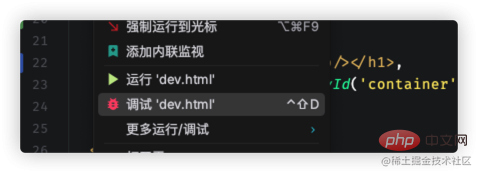
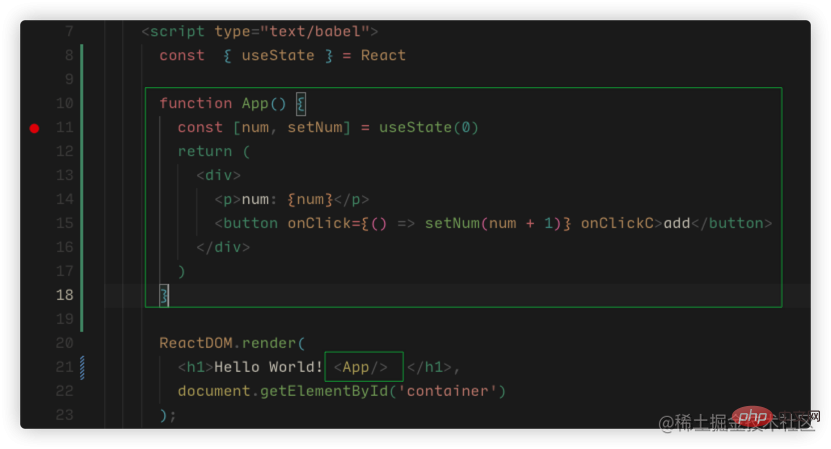
react,react-domto the global in the React project.
Note: You need to execute it according to your actual current location. In short, go toThe following is a successful one:build/node_modules/react
andbuild/node_modules/react-domJust executenpm linkseparately.cd build/node_modules/react && npm linkCopy after login

cd .. && cd react-dom && npm link

③: 在create-react-app的项目中link react与react-dom
npm link react react-dom
大功小成,接下来开始正式的debugger.
官方已经给出部分文档, 参考文档:文档
yarn start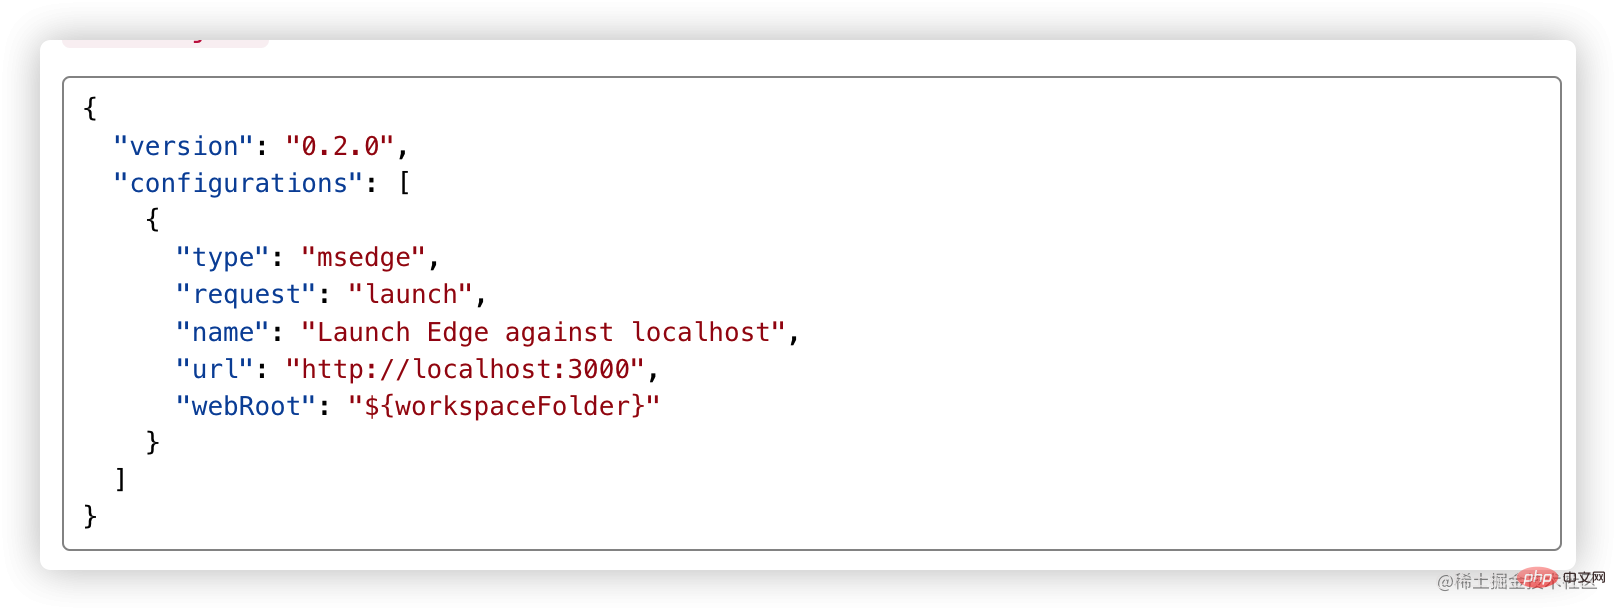
注意:
1、如果你项目端口进行了修改,需要把上方的端口也做修改.
2、官方提供的是edge浏览器,如果你想改谷歌浏览器只需要把type修改为chrome
笔者的配置如下:
{ "version": "0.2.0", "configurations": [ { "type": "chrome", "request": "launch", "name": "调试creat-react-app源码", "url": "http://localhost:3000", "webRoot": "${workspaceFolder}" } ] }
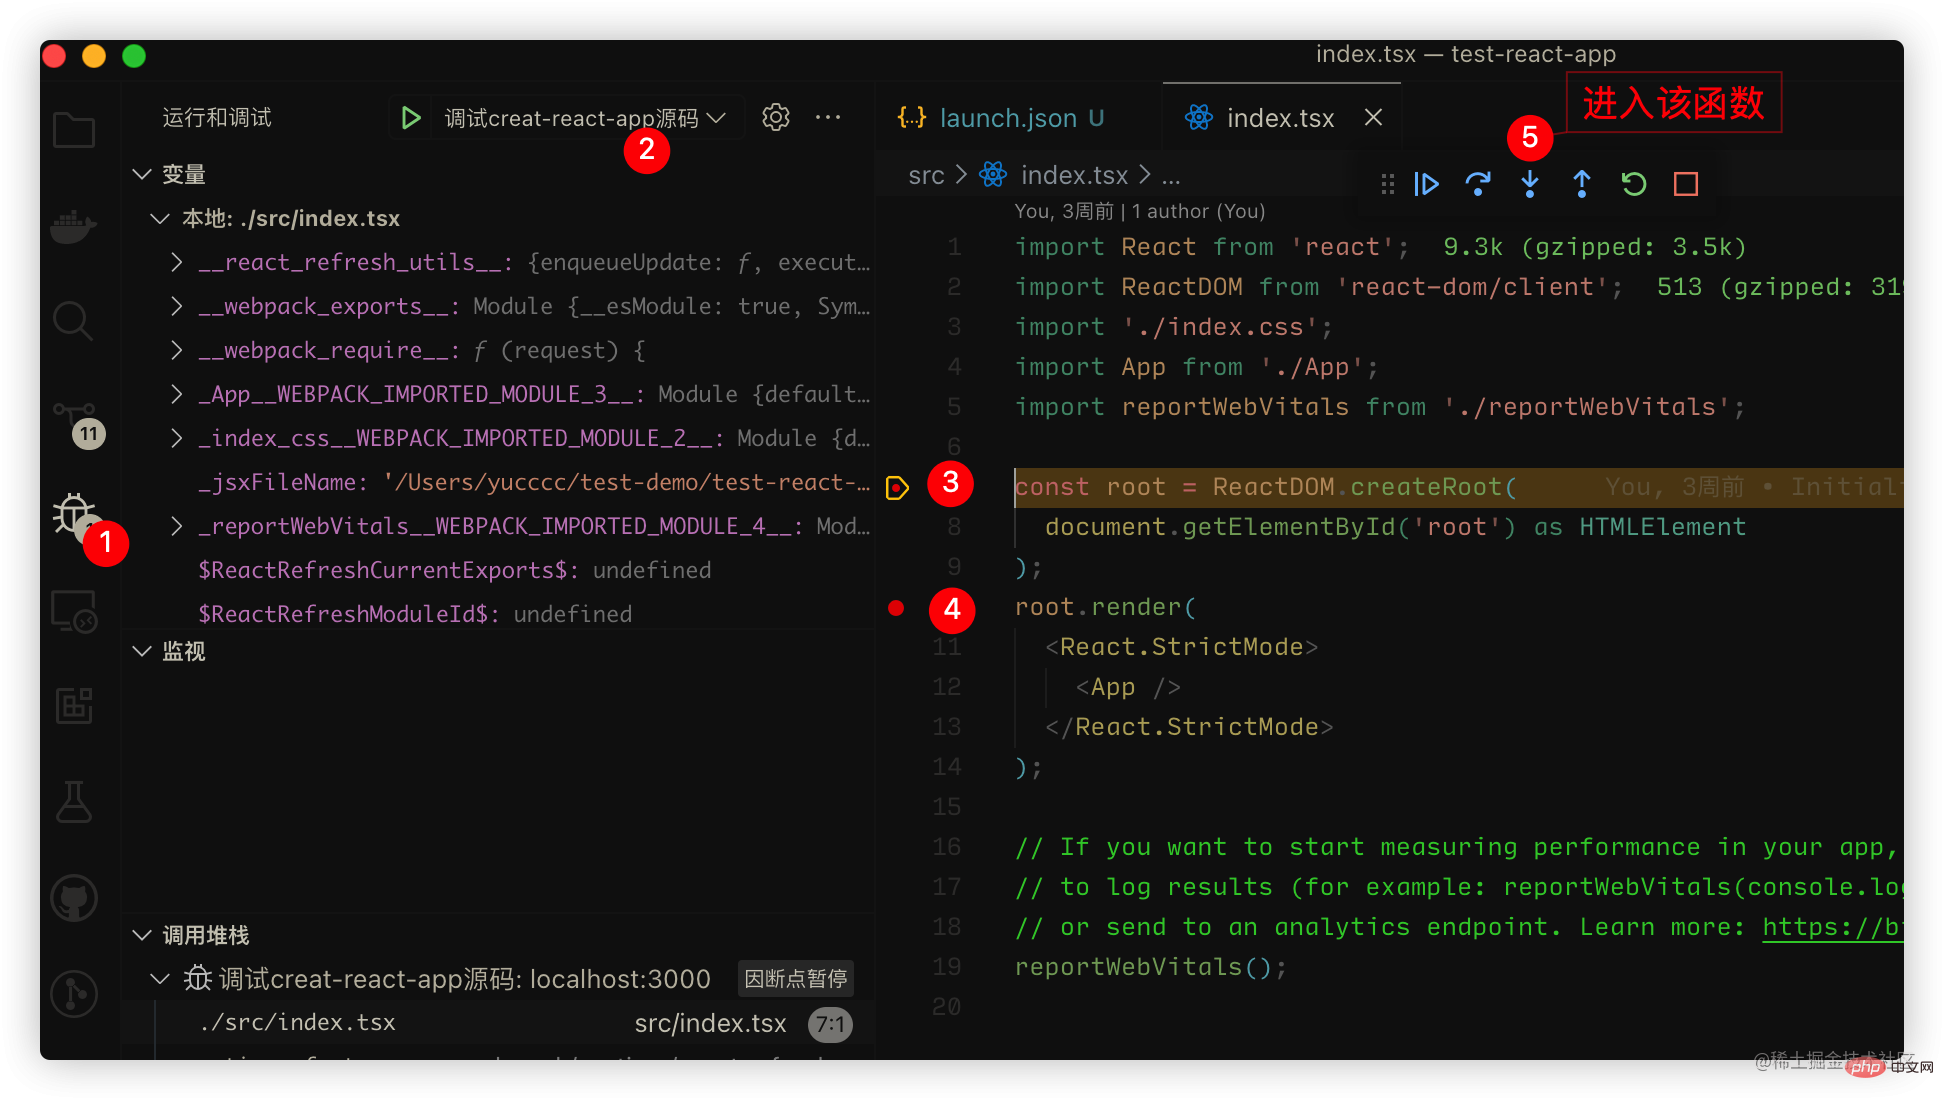 ③、④为我打上断点的位置,点击 ⑤ 即可看到进入源码啦(可能要多点几下)
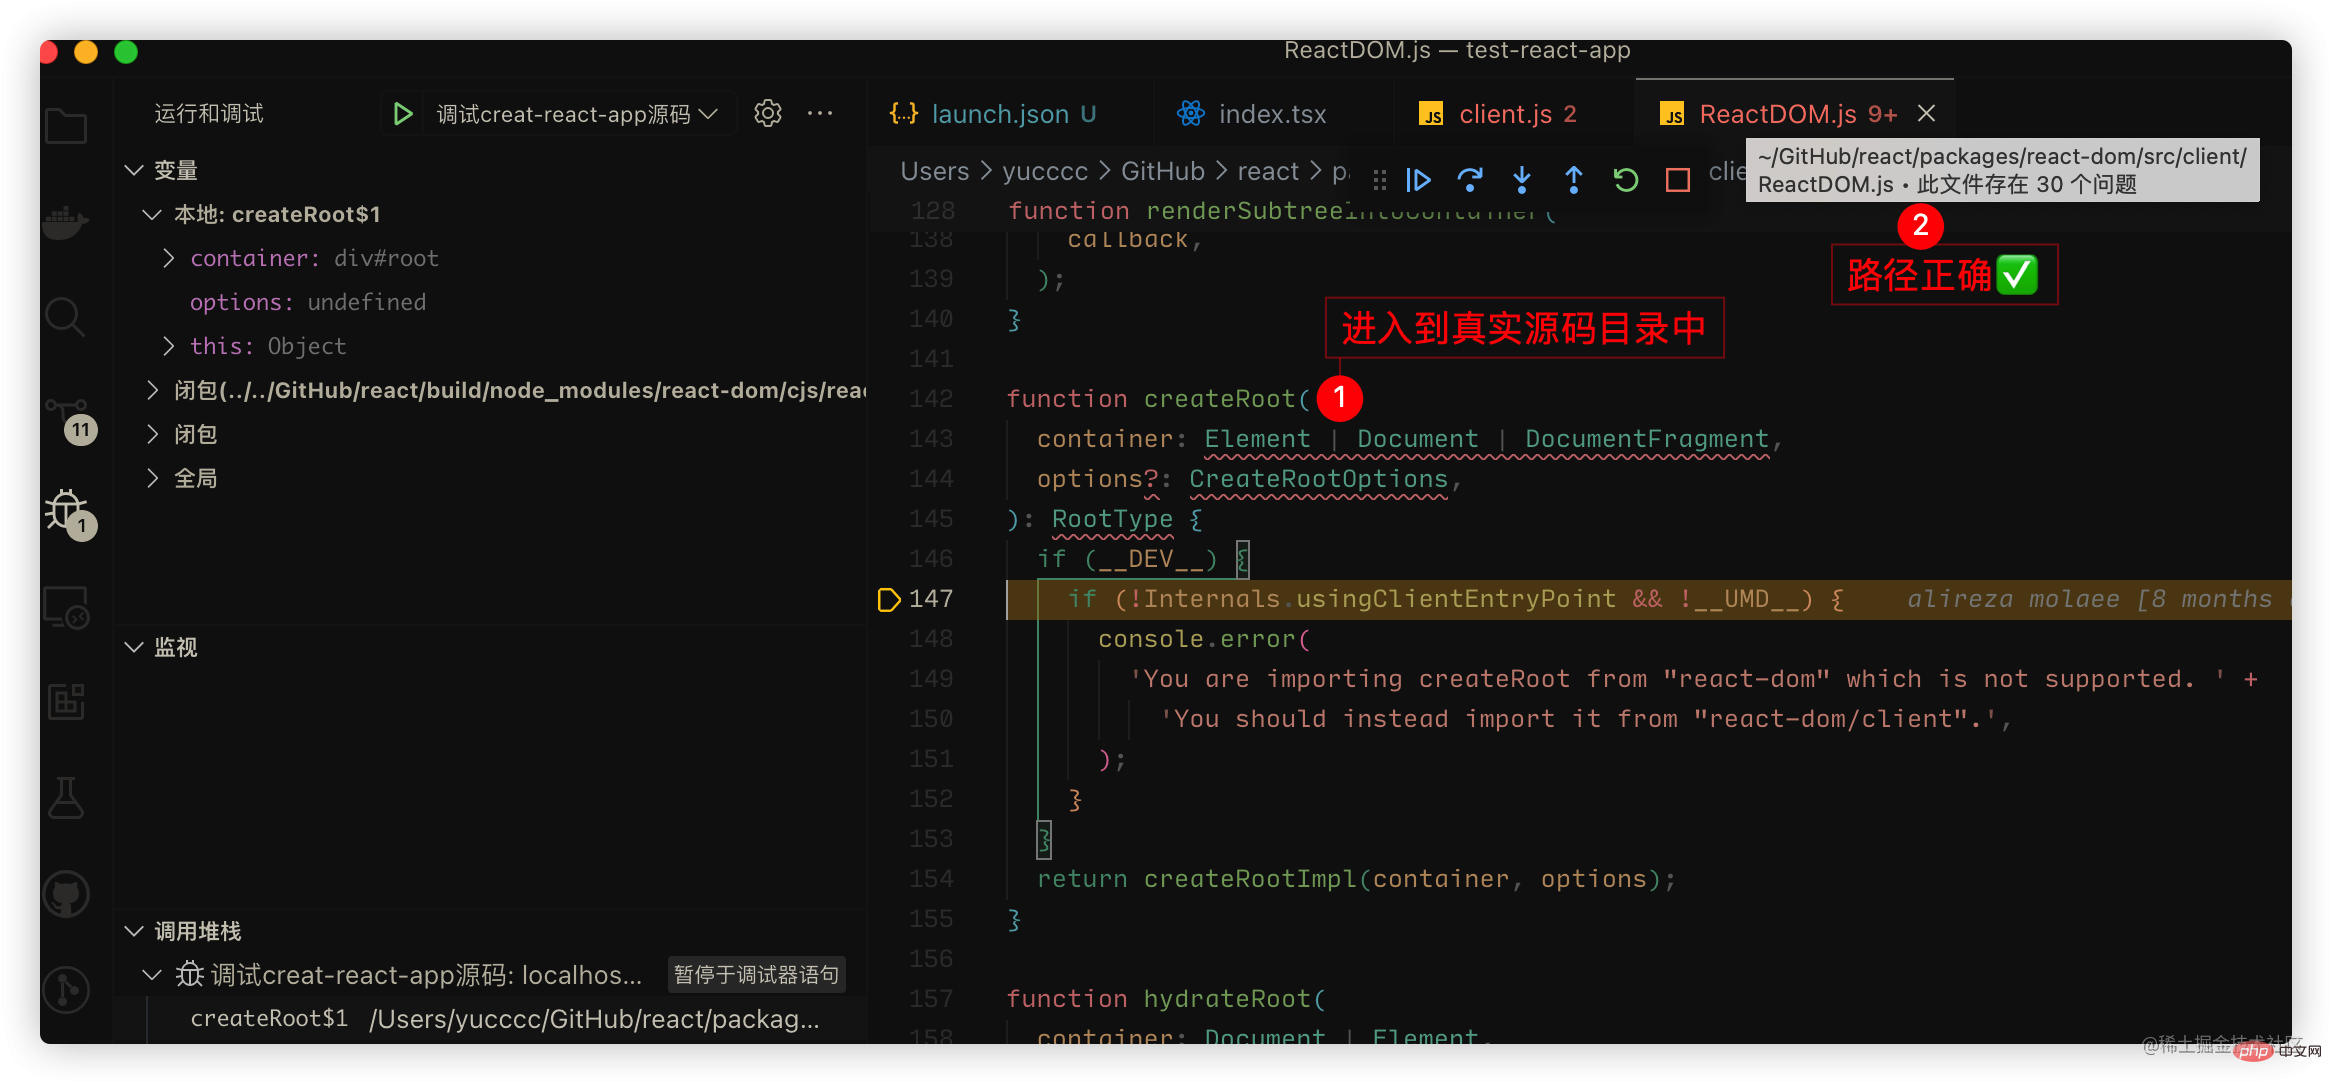
至此:我们已经大功告成,可以进行源码调试。
webstorm就显得十分简单,参考官方文档:文档
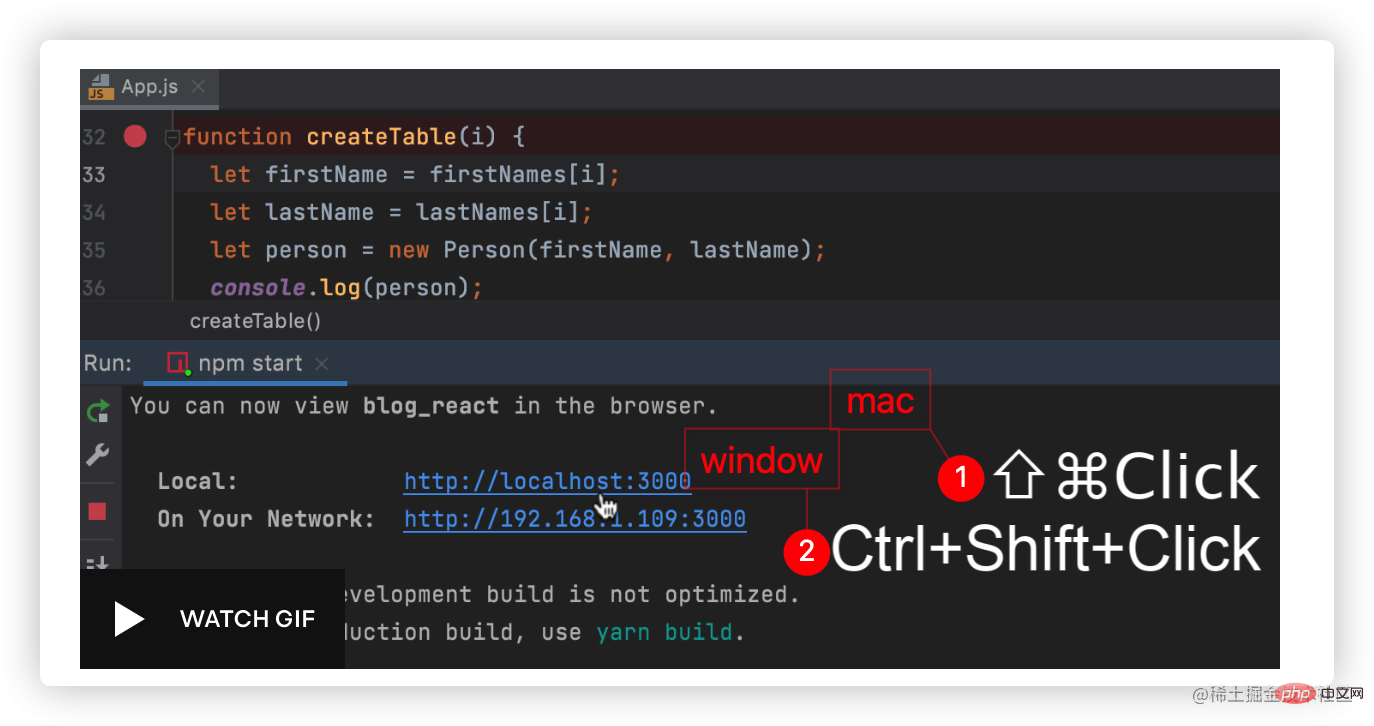
和上方一致,也是通过link
调试源码的逻辑核心在于sourcemap,但是我们不难发现其中存在一些问题:
1、当前我们跨项目进行调试(源码在react项目中,我们的项目在另外一个文件中),导致类型管理出现问题, 这是基于开发项目的定义管理,不同编辑器表现不同.
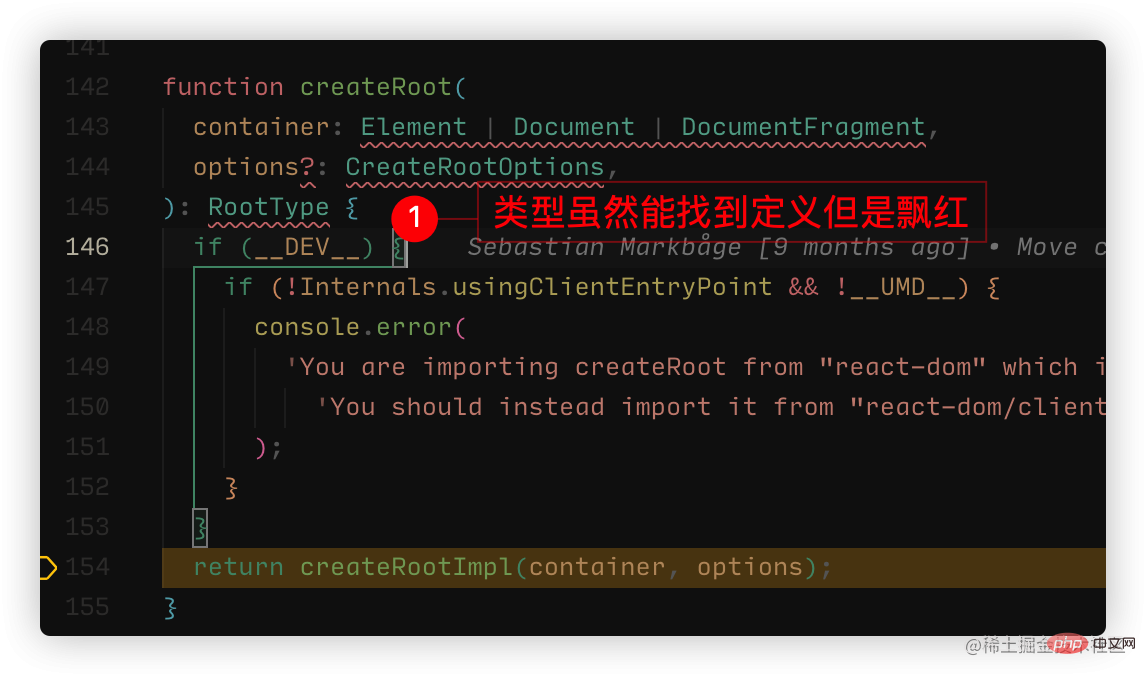 这是因为vscode默认解析ts的,但是不会默认识别flow的语法,所以这种的代码会解析成ts语法,就会报错,我们在项目增加
.vscode/settings.json增加配置:{ "javascript.validate.enable": false }
即表现正常,不再报错: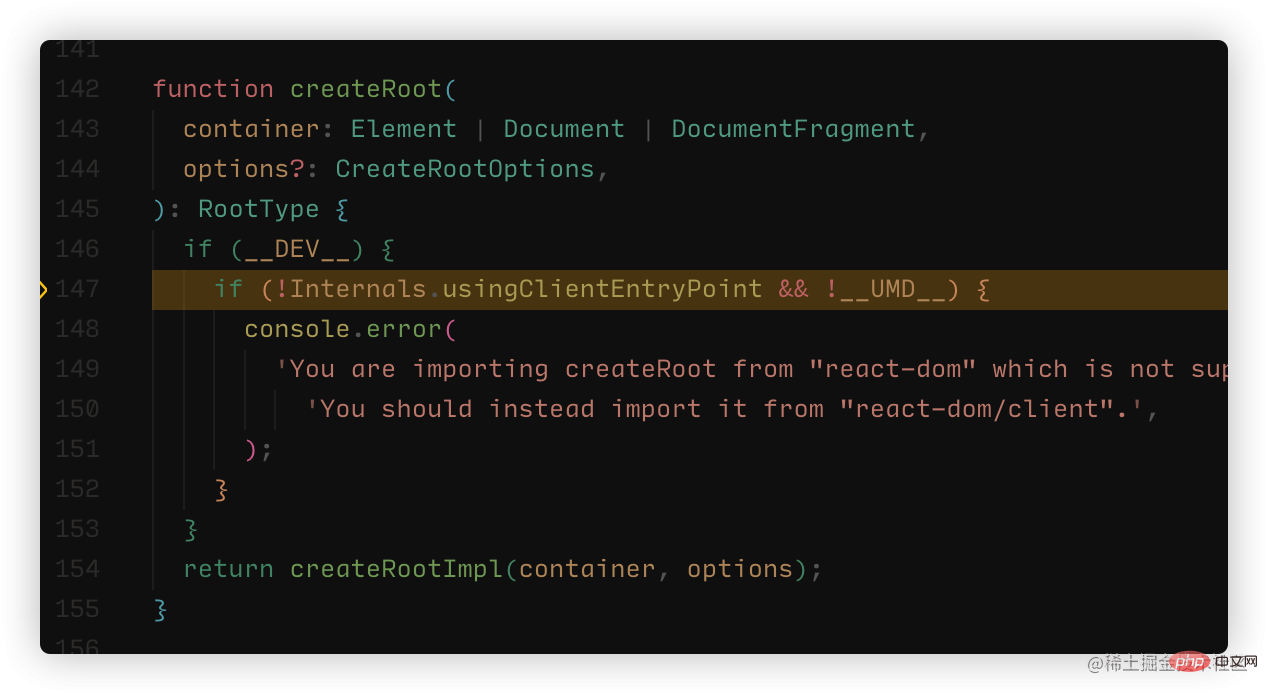
webstrom则是无法找到定义
更多关于VSCode的相关知识,请访问:vscode基础教程!
The above is the detailed content of How to debug React source code? Introduction to debugging methods using multiple tools. For more information, please follow other related articles on the PHP Chinese website!