This article brings you relevant knowledge about VS Code. It mainly introduces how to use VS Code to debug the code in the PhpStudy environment. Friends who are interested can take a look at it together. I hope it will be helpful to you. Everyone is helpful.
In recent months, all projects have been moved to VS Code (except because of Unity debugging problems, they have been used back to Visual Studio), and PHP has been abandoned. The strongest PhpStorm.
During this period, I took some time to help a friend with a PHP project. However, I have never used the PHP debugging function. Suddenly I found a bug in a project, but I couldn't print anything, and no error was thrown. . This is outrageous. Ever since, I started to fill in my knowledge blind spots again, and I also wanted to use PHP's debugging function.
Configuring PhpStudy
I am using a WNMP environment, the web server is Nginx, and the Apache environment is the same process .
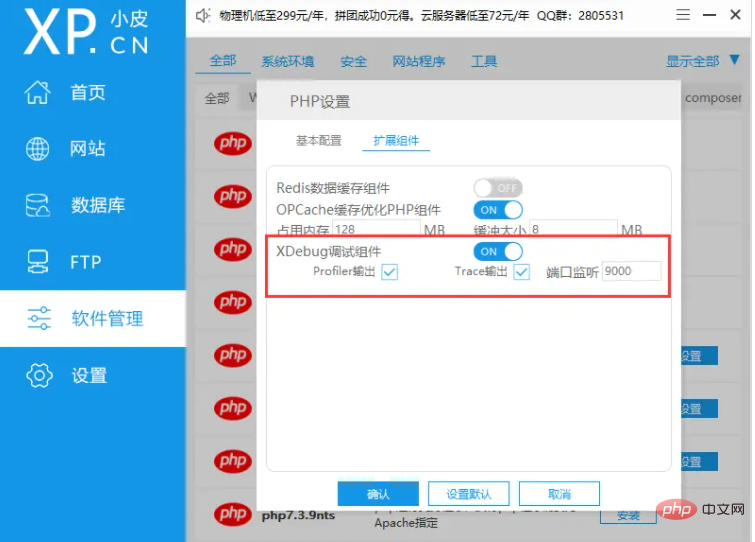
Use the default version of PHP
Using the default version of PHP is quite simple, just open the XDebug debugging component.

#After configuration, you can skip the following part and go directly to configure VS Code.
Use a customized version of PHP
Why don’t I say that I am so slow in making things, because I often want to know why and Other methods. So instead of using the default PHP version, I wanted to update to the latest version of PHP 7.x.
Download the new version of PHP
Go to the official website to download the latest PHP 7.4.33 - https://windows.php.net/download , I am using the nts version. After the download is completed, put it in the corresponding directory of phpstudy, for example X:\path\to\phpstudy_pro\Extensions\php. Change the folder name to the same rule, for example php-7.4.33nts.
Download and configure XDebug
The package just downloaded does not contain the XDebug plug-in, we need to download and configure it ourselves.
XDebug The official website has a very considerate function, which is to paste the information output by the local php_info into the input box, and it can help you analyze the information you want to download. version and give the download address. Enter the URL https://xdebug.org/wizard and click the *Analyse my phpinfo() output* button.
Copy the downloaded dll plug-in to the php-7.4.33nts\ext directory, and then add the following information to php.ini (add directly Just at the end, make sure it is after the OPCache configuration):
[XDebug]
zend_extension="D:\phpstudy_pro\Extensions\php\php-7.4.33nts\ext\php_xdebug.dll"
xdebug.mode = debug
xdebug.start_with_request = yes
xdebug.client_port = 9000
xdebug.remote_autostart = 1
xdebug.collect_params=1
xdebug.collect_return=1
xdebug.auto_trace=On
xdebug.remote_enable=On
xdebug.remote_host=localhost
xdebug.remote_port=9000
xdebug.remote_handler=dbgp
Remember to change the value of zend_extension to the actual path and actual location of your plug-in name.
First restart the web server (whether Nginx or Apache), and then use phpinfo() to print the PHP information to see if there is XDebug Plugins.

Configure VS Code
Make sure the PHP Debug plug-in has been downloaded in VSCode. You can search to download, or click here to jump and download - https://marketplace.visualstudio.com/items?itemName=xdebug.php-debug
Open file->Preferences-> ;Set , add the following content in the configuration:
"php.validate.executablePath": "D:/phpstudy_pro/Extensions/php/php-7.4.33nts/php.exe"
Finally click the *Run and debug* button directly, and add it to the created launch.json A configuration, or find an existing configuration to modify:
{
    "name": "Listen for Xdebug",
    "type": "php",
    "request": "launch",
    "port": 9000
}For more knowledge about VSCode, please visit: vscode Basic Tutorial!
The above is the detailed content of Detailed graphic explanation of VSCode debugging code in PhpStudy. For more information, please follow other related articles on the PHP Chinese website!


