

Scout APM is a Laravel application performance monitoring tool that ties performance exceptions directly to endpoints, saving developers hours of time spent troubleshooting and debugging.
Scout recently expanded its service offerings to include microservices and managed service monitoring for PHP applications, giving you more cohesive and actionable observability metrics. Learn more about how to monitor Laravel applications with Scout APM by reading the following.
To start monitoring your Laravel application, you first need a Scout account. If you haven't already, you canSign up for a 14-day free trial here (no credit card required).
The next thing to do is to add the low-overhead monitoring agent to the project's dependencies, this can be done by using a command in the shell:
composer require scoutapp/scout-apm-laravel
This command will install both Packages: scout-apm-laravel and scout-apm-php. The next step is to define some configuration to link the proxy to your account. To do this, open your project's.envfile in your text editor and add the following three lines of configuration to the file:
SCOUT_MONITOR=true SCOUT_KEY=”enter your Agent Key here” SCOUT_NAME=”enter the name of you application here”
You can do this inScout's Find your account's proxy key on the Settings page. Deploy and in about 5 minutes your data will start appearing in Scout. For more information about installing Heroku or troubleshooting installation issues, check out the documentation or email support@scoutapm.com and we'll be happy to help.
Now you've created a Scout account and connected the monitoring agent, but where do you start diagnosing performance issues with your application? Let’s take a look at Scout’s key features that can help you quickly understand performance issues.
When you log into Scout, the first page you see is the overview page (shown below), which gives you a clear, uncluttered application Health and performance snapshots at a glance.
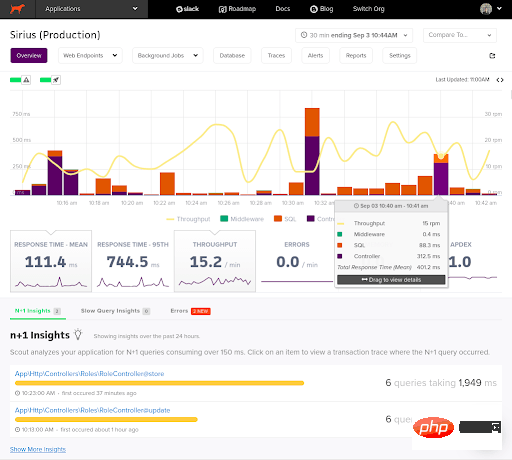
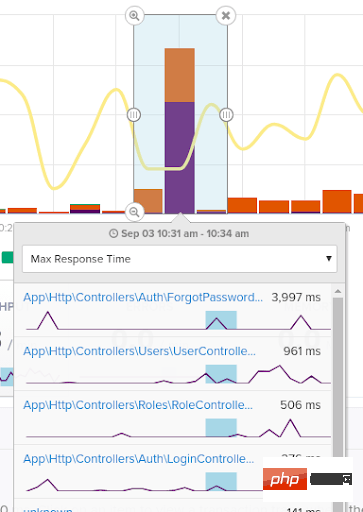
The chart is highly configurable, allowing you to change the time period and switch which metrics you want to view. It also features a neat drag-and-drop tool (shown below) that lets you draw a box around the area you'd like to explore in more detail. As you draw these boxes, a popup will dynamically load showing all endpoints visited during this time period. This feature is especially useful when you see a performance spike on a graph and want to understand its cause.
If you are trying Scout for the first time, a great place to start is with the Insights tab. Here we have a set of algorithms that analyze your project to identify potentialn 1 queriesandslow queries. These provide you with "low-hanging fruit" performance fixes that can often improve your application's performance immediately.

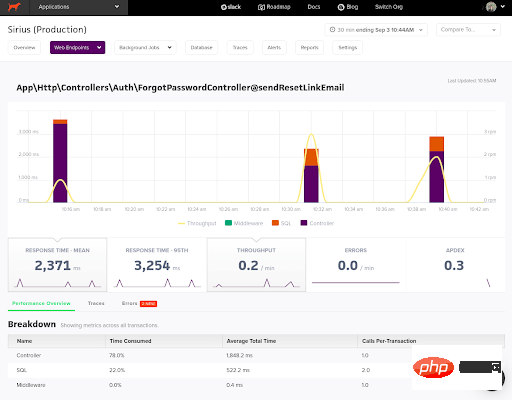
Scout mainly provides two levels of application performance metrics. First, look at it from an endpoint perspective. For example, on average, how long does it take to access this endpoint? Where is the time spent?
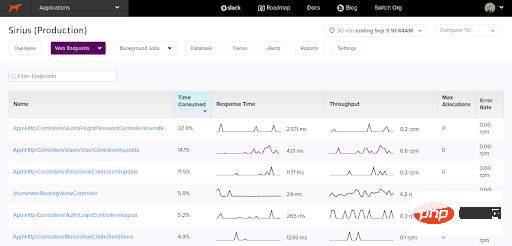
If you look at the screenshot below, you can clearly see that out of the 2,371 ms average request time for the 3 visits to this ForgetPasswordController endpoint, 78% was spent at the controller layer, which indicates that this will be The first one investigates if we want to try to improve this slow endpoint.
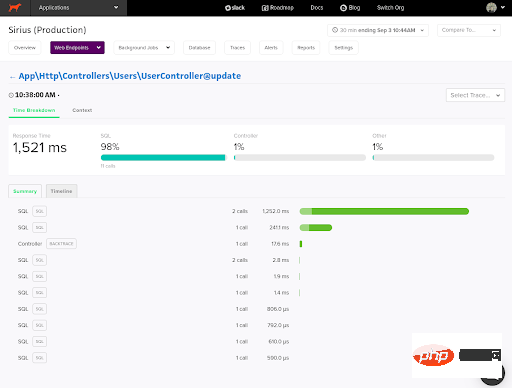
#The second angle from which Scout primarily displays metrics is at the Trace level. For example, during the time someone made this particular web request, how long it took to complete, and which levels of the request consumed the most time, etc. Looking at the trace of the update operation of the UserController below, we can see that in this case, 98% of the time is spent on the SQL layer, and most of the time is spent on the 2 calls to the first row of the query superior. If we click on that SQL button, we can see a traceback to see if we can improve the query.
These pages are where you spend most of your time in Scout, and they provide you with the visibility that is essential when trying to understand your performance issues. You can access theEndpointandTracepages directly from the main overview page and Insights tab, or by clicking the Web Endpoints link at the top of the page (shown below).
Now that we've covered the basics of Scout and shown you the main areas of the system that you'll typically use day in and day out, let's turn our attention to some more In terms of advanced features, these features make Scout stand out in the APM field.
Whether you are using Sentry, Honeybadger, Bugsnag or Rollbar for error monitoring, we have you covered! Scout integrates seamlessly with these popular services, allowing you to monitor all in one place on the main overview page.

No matter which service you use, the setup process is similar, andall that involves is adding the API tokenon Scout's setup screen .
Why does this performance issue only occur from a Brazilian IP address at 2:00 AM on a Tuesday night? These difficult (but common) performance issues can be solved with one of Scout's most powerful features: the Trace Explorer used in conjunction with user-defined custom contexts.
Using a defined custom context allows you to tell us what you need to see. It's worth investing therelatively short setup timeto gain monitoring superpowers! By default, the only context fields you will see are the URI and hostname, as shown below, but these can be customized to whatever you want.
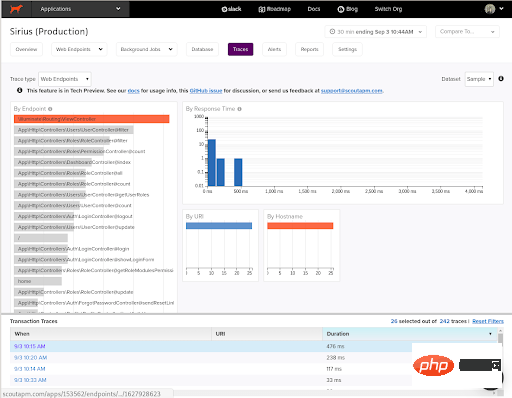
Trace Explorer's multi-filter chart (shown above) allows you to check for endpoints that match the criteria you define, and then you can View all traces matching these filters in the Transaction Traces section of the screen. For example, maybe you want to view web requests for a specific user, or for all users of a plan, or from a certain region of the world. These operations are easy to complete in Trace Explorer with custom context, and they can help you gain insight into hard-to-diagnose, time-consuming performance issues.
Do you think this performance issue suddenly started happening after the last deployment? What was the user experience like during your deployment? These are answers that can be answered using the deployment tracking feature, which will place a rocket symbol on the main overview chart to indicate when a deployment occurs.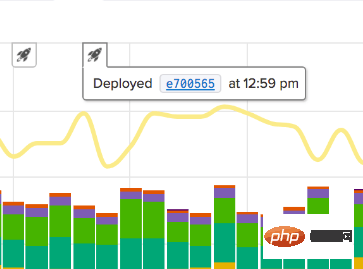
Deployment tracking also allows you to view details such as the number of commits involved in the deployment and which branch the commits came from. We can collect all of this information when you add SHA or your deployment to theSCOUT_REVISON_SHAenvironment variable.
Like all good monitoring solutions, Scout gives you a sophisticated alerting system that can be configured to alert you when endpoint response time or memory usage metrics exceed a certain threshold. Send alerts to certain people. These alerts will be displayed as a warning symbol on the main overview map and a notification will be issued.
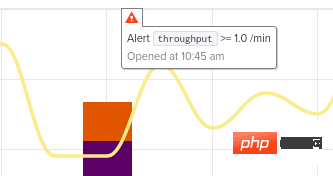
By default, system alerts will send notifications via email to users in the notification group, but they can also be configured with Slack, VictorOps, PagerDuty via our webhook feature Wait for third-party services to work together.
Are you using a library outside of Laravel that we don't currently detect? If so, then first let our support team know and we will try to add support for you. In the meantime, you can add some custom tools yourself, it's very easy to get started and it will ensure you have full visibility into the entire application.
As you can see, Scout APM brings a very mature APM monitoring solution to the PHP and Laravel communities. Our clean UI and in-depth tools help you get to the heart of your problem quickly, while remaining affordable thanks to a flexible transaction-based pricing structure.
Original address: https://laravel-news.com/scout-apm-for-monitoring-a-laravel-application
Translation address: https://learnku. com/laravel/t/68744
[Related recommendations:laravel video tutorial]
The above is the detailed content of How to monitor Laravel program using Scout APM?. For more information, please follow other related articles on the PHP Chinese website!