
Debugging tools include: 1. Web browser developer tools, such as using the console statement "console.log()", or using the debugger statement to pause code execution; 2. Postman, a debugging interface tool, can Adjust requests, analyze responses and debug problems; 3. Sentry, which can be used to monitor errors and extract all the information needed to perform appropriate post-action actions; 4. JSHint, a JS code analysis and detection tool; 5. Firebug, which can help developers discover The code finds the wrong errors and resolves them.

The operating environment of this tutorial: windows7 system, javascript version 1.8.5, Dell G3 computer.
Application vulnerabilities are the source of baldness for front-end debuggers. If you've been working on the front end, you know how difficult it is to fix application vulnerabilities.
Especially when using JavaScript, a small error can sometimes take hours to debug. However, vulnerabilities are inevitable across browsers, operating systems, and devices.
There are many tools for bugs, but not every one of them can be called a "bug nightmare". Some tools perform better than others. This article will introduce you to these little helpers for discovering, diagnosing and repairing vulnerabilities.
Web Browser Developer Tools
Any modern web browser comes with powerful tools to help you debug your application. It can be as simple as a console statement using console.log(), a popup window using alert(), or even a debugger statement to pause code execution. These tools are very useful in debugging tasks, especially debugger statements.
You can also use the network inspector or CSS styles inspector to make debugging easier and smoother. You can simply search on Google to learn more about your browser’s developer tools.

Postman
Almost all front-end applications send and receive JSON responses and requests. Apps connect to an API that can do many things such as authentication, user data transfer, and even simple things like getting current weather information for your location.
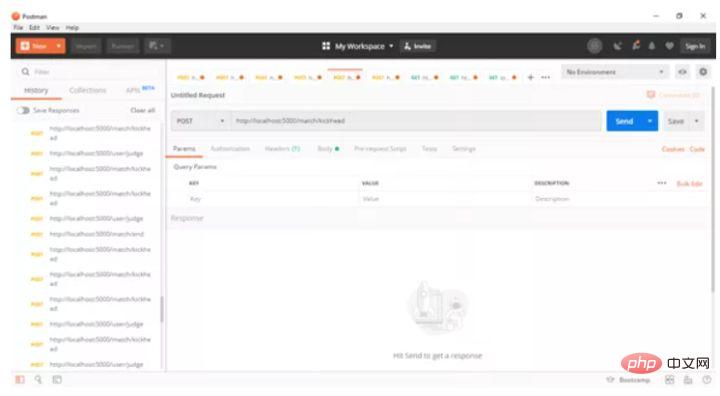
Postman is one of the best JS tools for debugging requests and responses. It also provides software for macOS systems, Windows systems, and Linux systems. It makes it fast and easy to send REST, SOAP and GraphQL requests directly.
Using Postman, you can adjust requests, analyze responses and fix vulnerability issues. It's useful when you're not sure whether the problem is on the front end or the back end.
sentry
Once an app is released, it is available on a variety of devices run. In any software development life cycle, the testing phase is implemented as a standard process. This phase includes unit testing, system testing, integration testing, etc.
However, there is always the possibility that you may overlook a vulnerability and allow it to continue in production. Even after release, you won't be aware of any remaining vulnerabilities without anyone notifying you. End users rarely report vulnerabilities via the provided email. This is where Sentry comes into play.
A cloud-based error logging system like Sentry can help you log error instances even after release. Sentry offers comprehensive solutions covering most available frameworks.
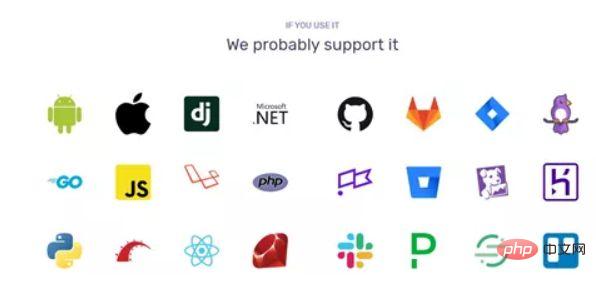
Sentry applicable languages and frameworks
BrowserStack
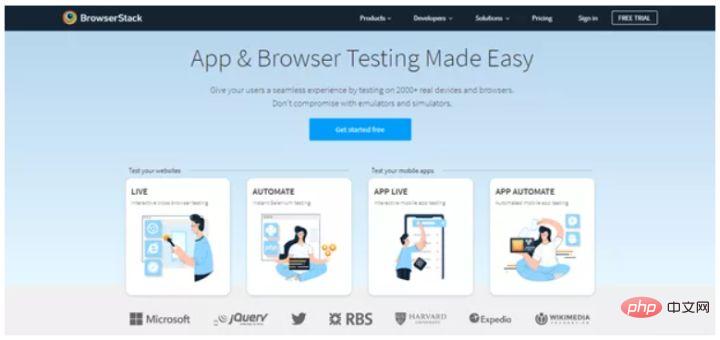
BrowserStack can help simulate The exact context in which the user encountered the error. A powerful combination of devices, operating systems, and browsers is an absolute must. You can make the most of it by using an error logging tool like Sentry.
When you log an error, you can reproduce the exact scenario by referencing the environment and recreating it in BrowserStack.
They offer lower prices for freelancers and free licenses for open source projects.
JSHint
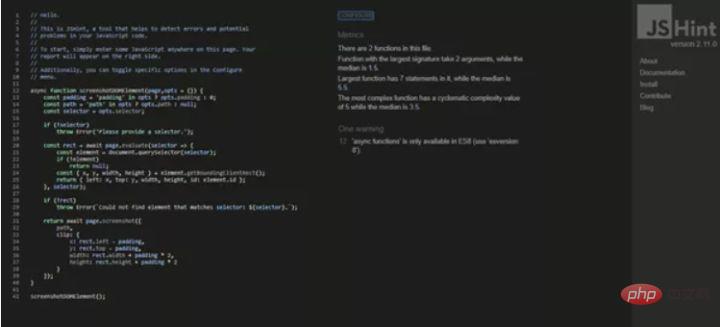
This is a static code analysis that detects errors and potential problems in JS code Tools that can help developers find hard-to-find problems.
JSHint scans programs written in JavaScript and reports common errors and potential vulnerabilities, which may be syntax errors, vulnerabilities caused by implicit type conversion, leaked variables or some other problems.
Here is an example function I use to observe JSHint running:
Firebug
Firebug is a very powerful tool that can help you find errors in your code and solve them.
Here we use Firebug to process Javascript code.
First we need to load the page and open Firebug.
Sometimes you need to reload the page.
The number of errors in the status bar

Display the errors on the current page

Show error details
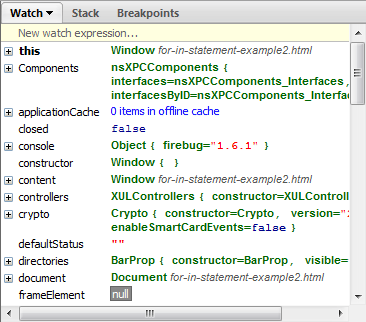
##Debug the code step by step
You can execute the code step by step. This is very useful for code debugging.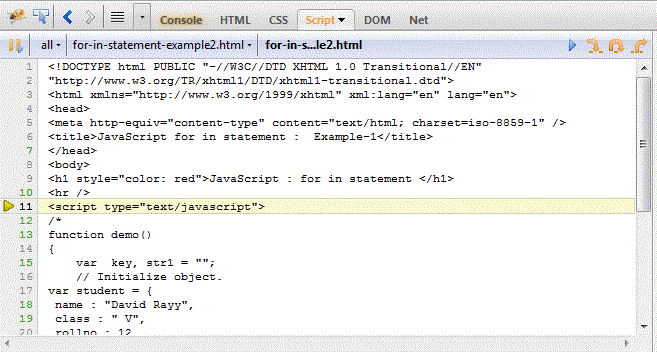
Use breakpoint debugging
Breakpoint debugging can terminate the execution of the code. You can check the error by specifying the code range. Not within the specified code range. This is useful for error debugging. If you click the "Step over" button, Firebug will update all variables until you terminate the breakpoint execution in the right window.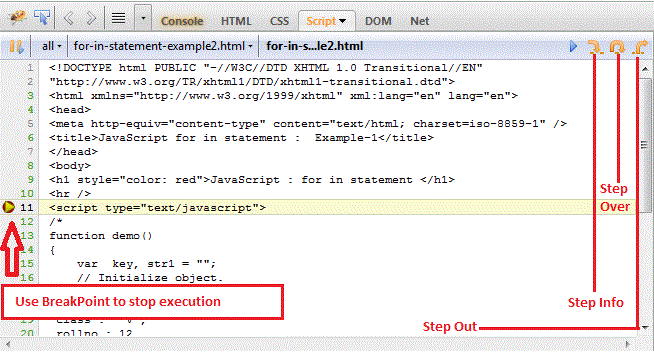
Use expressions to make breakpoints work
You can write an expression so that when the condition is true, the breakpoint will Stop code execution.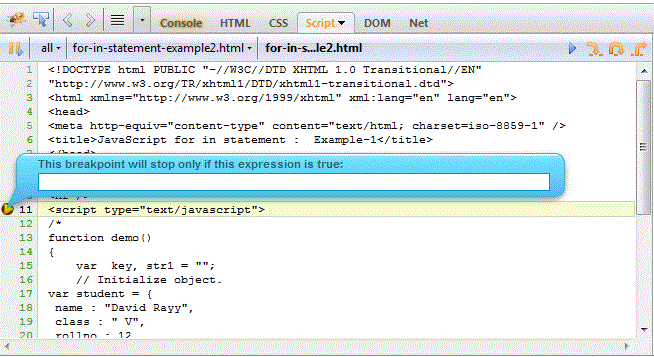
Fiddler
Fiddler is a local proxy server and the browser needs to be set as a local proxy server It can only be used when surfing the Internet. Fiddler will monitor all browser requests and has the ability to insert data into browser requests. In the process of web front-end development, fiddler is the most commonly used debugging tool. In most cases, the functions of fiddler's default menu can basically meet the developer's debugging needs. However, if more complex debugging scenarios need to be met, the developer's debugging requirements can no longer be met simply through the fiddler menu. If the user needs to modify the header of the http request or modify the response header of the http request, he can only set a breakpoint. There are two ways to set a breakpoint: The first way : Open Fiddler and click Rules-> Automatic Breakpoint ->Before Requests (this method will interrupt all sessions). To eliminate breakpoints, click Rules-> Automatic Breakpoint ->Disabled. Second: Enter the command in the command line: bpu http://www.qq.com. This method will only interrupt http://www.qq.com. The way to eliminate the breakpoint is Enter the command bpu on the command line. But these two methods will stop when the program reaches the breakpoint, and you need to manually click "Run to Completion" to restart, which is very inconvenient. Moreover, the URI of the http request cannot be modified through fiddler's menu function. At this time, the advantages of Fiddler Script are reflected. The essence of Fiddler Script is actually a script file CustomRules.js written in JScript.NET language. The syntax is similar to C#. By modifying CustomRules.js, you can easily modify the http request and Response, without interrupting the program, can also perform special processing for different URIs. In addition, the menu can be customized according to the needs of the developer.HttpWatch
HttpWatch is a commercial software and is embedded in the browser in the form of a plug-in. It is just a professional Web Sniffer . 【Related recommendations:javascript video tutorial, Basic programming video】
The above is the detailed content of What are the debugging tools for javascript?. For more information, please follow other related articles on the PHP Chinese website!