iSlide is a one-click efficiency plug-in based on PPT, including 38 design auxiliary functions, 8 online resource libraries, and over 300,000 professional PPT templates/materials; the software supports one-click font change for PPT, Paragraphs and colors can be selected according to the text progressive relationship, and the corresponding PPT page layout can be generated with one click to generate visual smart charts and very advanced animation effects.

The operating environment of this tutorial: windows7 system, iSlide 6.3.2.1, Dell G3 computer.
iSlide is a one-click efficiency plug-in based on PPT, a professional PPT efficiency plug-in that can improve creative efficiency. It contains 38 design auxiliary functions, 8 major online resource libraries, and over 300,000 professional PPT templates/materials, which can solve the pain points encountered by office workers in PPT design such as lack of materials, insufficient professionalism, and low efficiency.
iSlide is a very easy-to-use PPT plug-in that provides free theme templates, colors, vectors and pictures, and supports one-click replacement of fonts, paragraphs, and colors in PPT. The most important thing is that you can select the corresponding PPT page layout according to the progressive relationship of the text, generate visual smart charts with one click, and also create very advanced animation effects.
#PPT The 2 most important factors: logical content and design. The logical content is determined based on the content of our report, and iSlide can directly help us design the PPT, saving 90% of the PPT design time.
How to use iSlide and what functions are helpful for PPT?
1. Select a PPT theme
If I need to make a work summary PPT. After preparing the text content, open iSlide and click on the theme library. Here you can search for theme types by keywords and filter themes by application scenarios and styles.
The selected theme can be previewed directly. It supports downloading in 16:9 or 3:4 size. You can download it directly after selecting the theme.
2. Change the icon
When filling in the content, I felt that the theme template was a bit monotonous. I wanted more layouts that combined graphics and text, but according to different It is too time-consuming to create different layouts for the content. Fortunately, iSlide has an icon library.
This is the most useful function to visualize logical content. You can choose according to the logical relationship between the content, whether it is a directory, list, sorting, loop or other ,It will be all right. You can also select the desired layout based on the number of projects and the desired style. Preview is also supported.
The content of the downloaded icon page will change according to the theme color, and there is no need to adjust it separately, which is very convenient.
3. Change the pictures and illustrations of the PPT
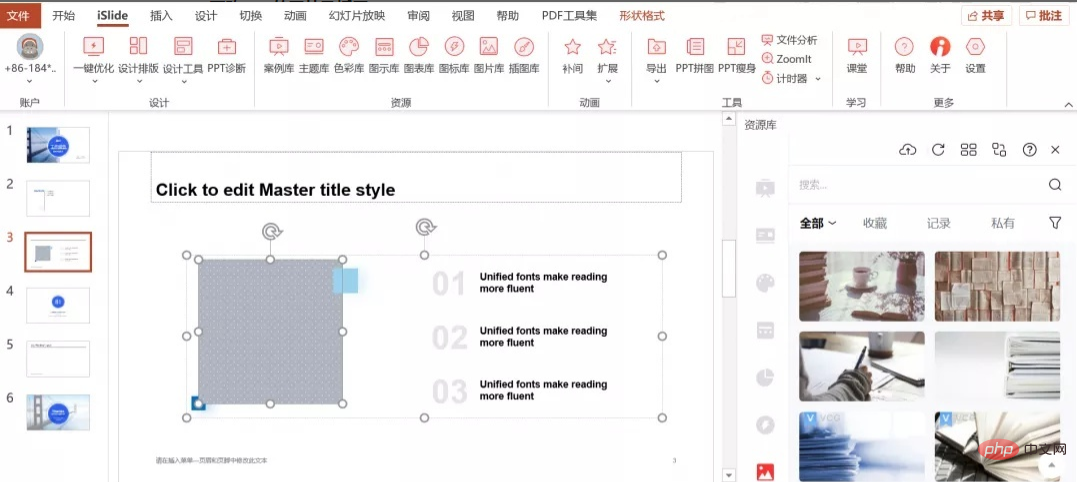
The pictures in the illustration page will not be downloaded together, and you need to change them yourself. Click on the placeholder shape and select the image library to use these copyright-free, commercial-friendly images.

The selected picture will be automatically adjusted according to the size of the graphic. It is very convenient to illustrate and change pictures. You can also upload local pictures to create your own picture library.
Icons and illustrations can also be changed with one click. After selecting the icons you want to change (click shift to select multiple icons), replace them with one click in the illustration library. It also automatically changes color and automatically matches size and shape.
4. Visual charts
The most difficult thing about making PPT is making charts, but the most indispensable part of making reports is charts. In the past, the form was moved directly up, which was unsightly and unintuitive. But with iSlide, things are different! Select the style directly in the chart library, edit the data, and create beautiful charts in just 2 steps.
First, filter the chart style you want. You can choose bar chart, column chart, gradient chart, donut chart, pie chart and others. Excel and smart charts are optional formats, and you can also select the quantity.
After inserting the chart, click Edit to adjust the data. The chart library allows people without design foundation to create visual charts.
For more related knowledge, please visit the FAQ column!
The above is the detailed content of What software islide?. For more information, please follow other related articles on the PHP Chinese website!


