This article will summarize and share with you 6 ways to break points in JavaScript. It is worth learning and collecting. Come and see how many of them you have used? I hope to be helpful!

#Debugger is a very important tool for front-end development. It can stop at the code we care about and clarify the logic through single-step operation. The quality of debugger is directly related to the quality of breakpoints.
Chrome Devtools and VSCode both provide Debugger, which supports 6 breakpoint methods.
You can add a breakpoint by clicking on the left side of the line you want to break, and it will break when running there.
This is the most basic breakpoint method. Both VSCode and Chrome Devtools support this breakpoint. [Related recommendations: javascript learning tutorial]
Right-click on the left side of the line where the code is located, and a drop-down box will appear , you can add a conditional breakpoint.
#Enter a conditional expression. When this line of code is reached and the value of the expression is true, it will break. This is more flexible than ordinary breakpoints.
This kind of breakpoint based on conditions is also supported by VSCode and Chrome Devtools.
Right-click on the corresponding element in the Elements panel of Chrome Devtools and select break on to add a dom breakpoint, that is, when It will be interrupted when the subtree changes, the attributes change, or the node is removed. Can be used to debug code that causes dom changes.
Because it involves DOM debugging, only Chrome Devtools supports this breakpoint.
You can add XHR url breakpoint in the Sources panel of Chrome Devtools. When the ajax request corresponds to the url, it will break and can be used to debug the request-related code.
This feature is only available in Chrome Devtools.
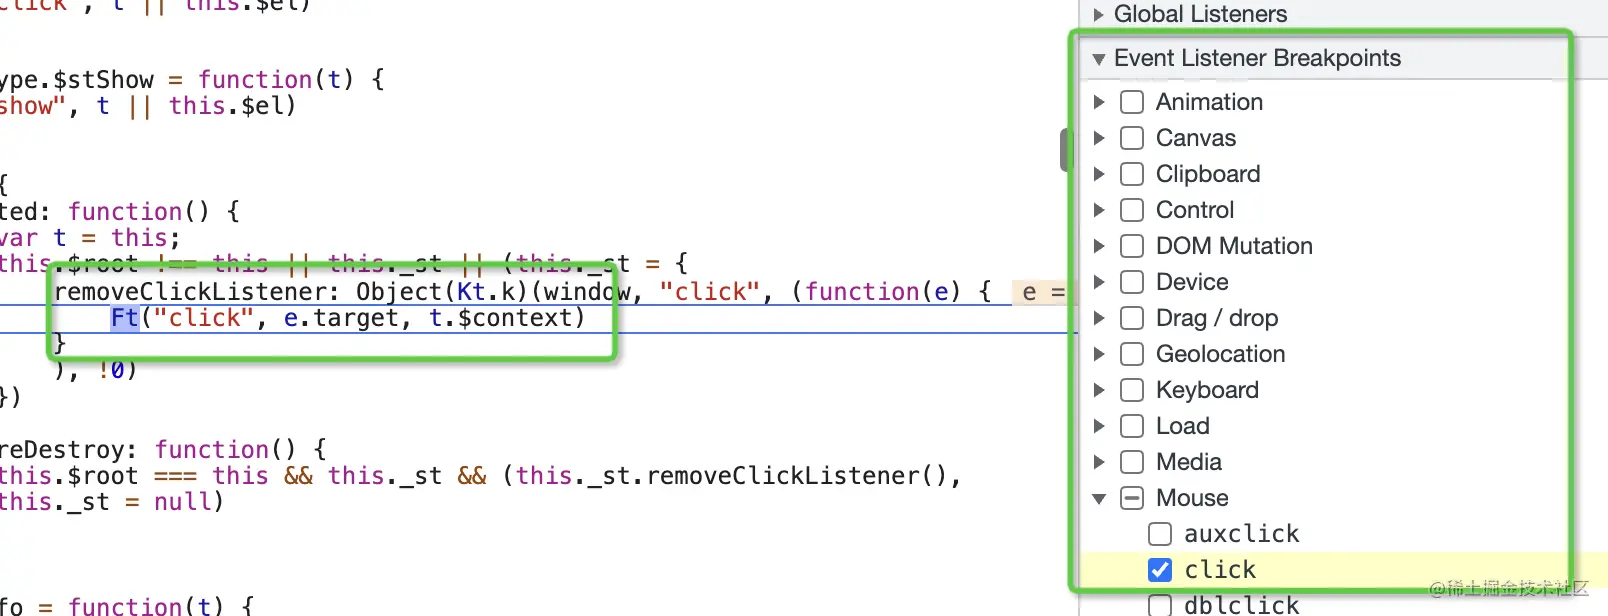
In the Sources panel of Chrome Devtools, you can also add an Event Listener breakpoint to specify what event to break when it occurs, which can be used to debug event-related code.

This feature is only available in Chrome Devtools.
Check Uncaught Exceptions and Caught Exceptions in the Debugger panel of VSCode to add exception breakpoints and break the column when an exception is thrown and is not caught or caught. It is useful when debugging some code where exceptions occur.
In addition to the ordinary breakpoints that are directly clicked on the corresponding line of code, Debugger has many breakpoints based on different situations. How to add breakpoints.
There are six types in total:
Most of these breakpoint methods are supported by Chrome Devtools (normal, conditional, DOM, URL, Event Listener, exception), and some are supported by VSCode Debugger (normal, conditional, exception).
Code under different situations can use different break point methods, so debugging the code will be much more efficient. How many of these six breakpoint methods have you used?
(Learning video sharing: web front-end tutorial)
The above is the detailed content of Summary and sharing: 6 ways to break points in JavaScript (collect for learning). For more information, please follow other related articles on the PHP Chinese website!