This article will share with you some useful Redis operation and maintenance tools to see how to monitor operating status, data migration, and cluster management. I hope it will be helpful to everyone!

When we apply Redis, we often face operation and maintenance work, including Redis running status monitoring, data migration, deployment and operation of master-slave clusters and slice clusters. . Next, I will introduce you to some tools from these three aspects. Let's first learn the tools to monitor the real-time running status of Redis. These tools all use a monitoring command provided by Redis: INFO. [Related recommendations: Redis Video Tutorial]
The INFO command provided by Redis itself will return rich instance running monitoring Information, this command is the basis of the Redis monitoring tool.
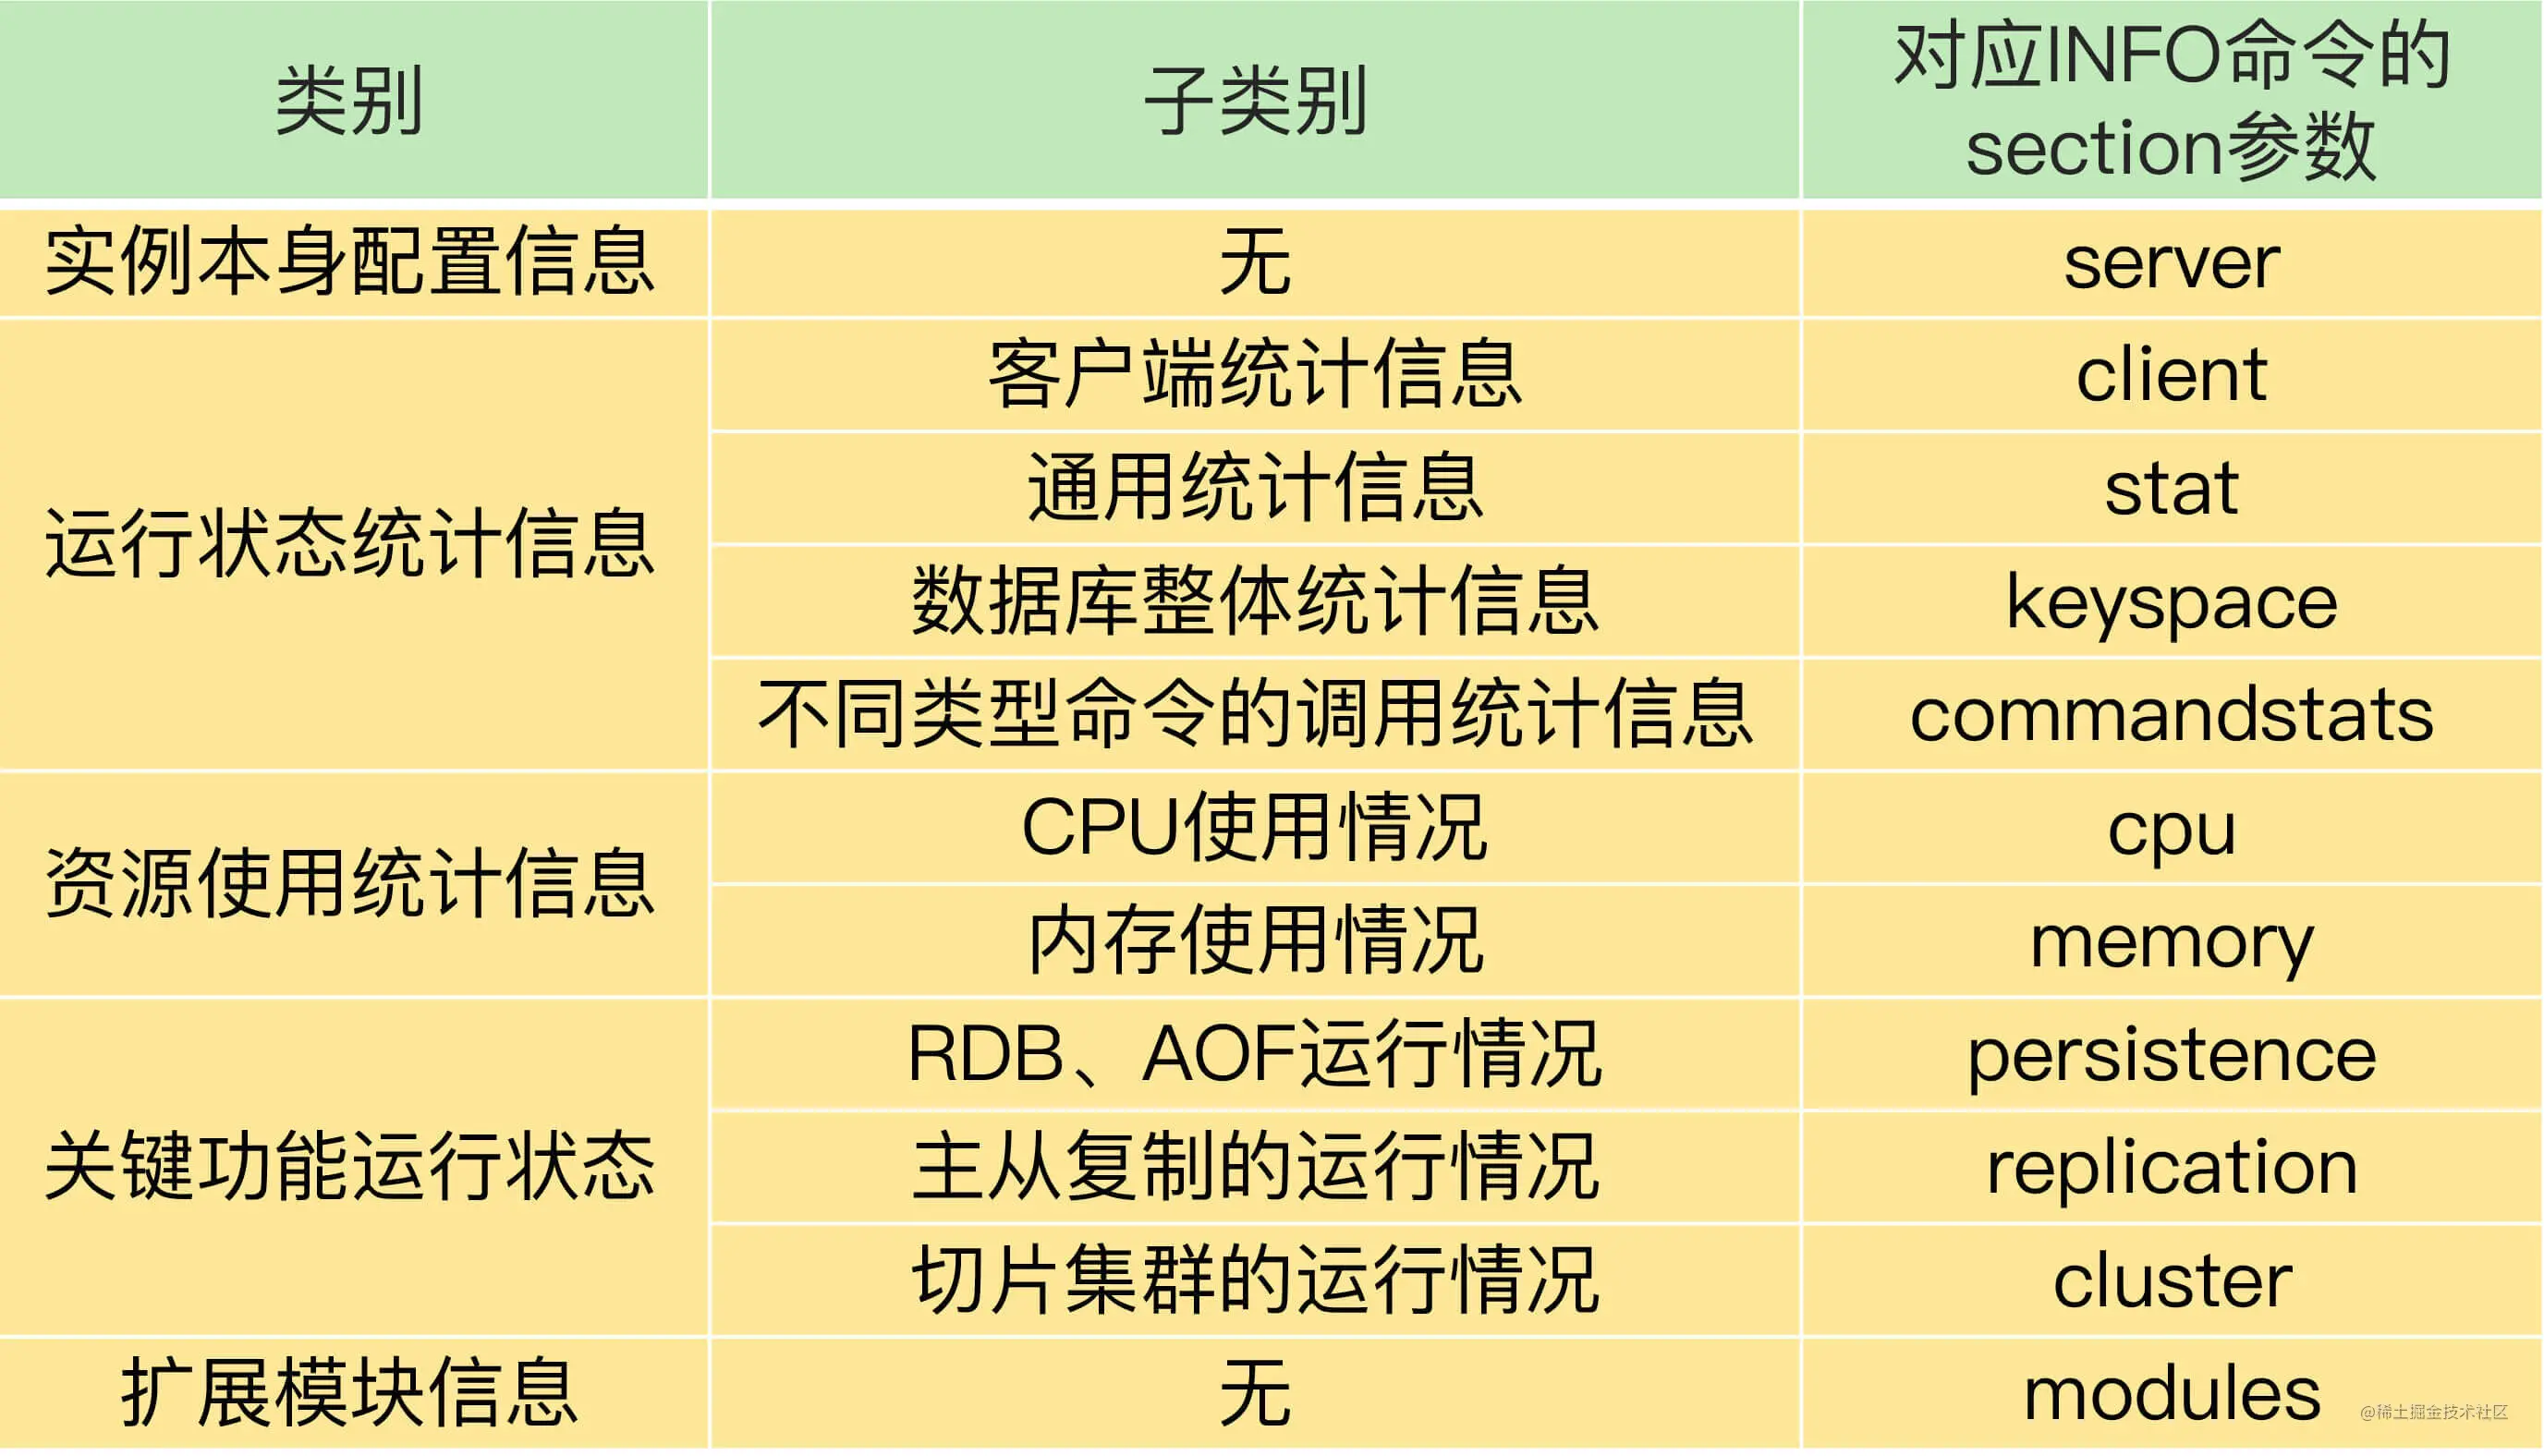
When using the INFO command, you can take a parameter section. There are several values for this parameter. Correspondingly, the INFO command will also return different types of monitoring information. I divided the return information of the INFO command into five major categories. Some categories include different monitoring content, as shown in the following table:

Monitoring Redis operation status, the results returned by the INFO command are very useful. If you want to know the detailed meaning of the results returned by all parameters of the INFO command, you can check the introduction of Redisofficial website. Here, I will give you a few parameters that need to be focused on during operation and maintenance, as well as their important return results.
First of all, Whether you are running a single instance or a cluster, I suggest you focus on the return results of the four parameters stat, commandstat, cpu and memory, which includes the command The execution status (such as the number of execution times and execution time of the command, the CPU resources used by the command), the usage of memory resources (such as the amount of memory used, memory fragmentation rate), CPU resource usage, etc., which can help us judge the instance. Running status and resource consumption.
In addition, when you enable the RDB or AOF function, you need to focus on the return result of the persistence parameter, through which you can view the execution status of the RDB or AOF.
If you are using a master-slave cluster, you must focus on the return result of the replication parameter, which contains the real-time status of master-slave synchronization.
However, the INFO command only provides monitoring results in text form and is not visualized. Therefore, in practical applications, we can also use some third-party open source tools to visualize the results returned by the INFO command. Next, I will talk about Prometheus, which can visualize Redis statistical results through plug-ins.
Prometheus is an open source system monitoring and alarm framework. Its core function is to pull monitoring data from the monitored system and combine it with the Grafana tool for visual display. Moreover, monitoring data can be saved to a time series database to facilitate historical queries by operation and maintenance personnel. At the same time, Prometheus will detect whether the monitoring indicators of the system exceed the preset threshold. Once the threshold is exceeded, Prometheus will trigger an alarm.
These functions are very important for the daily operation and maintenance management of the system. Prometheus has implemented a tool framework for using these functions. As long as we can obtain monitoring data from the monitored system, we can use Prometheus to implement operation and maintenance monitoring.
Prometheus provides plug-in functions to monitor a system. We call plug-ins exporters. Each exporter is actually a component that collects monitoring data. The data format collected by the exporter meets the requirements of Prometheus. After Prometheus obtains the data, it can be displayed and saved.
Redis-exporter is used to monitor Redis. It provides the running status and various statistical information monitored by the INFO command to Prometheus for visual display and alarm settings. Currently, Redis-exporter can support Redis versions 2.0 to 6.0, and has a wide range of applications.
In addition to obtaining the running status of the Redis instance, Redis-exporter can also monitor the size of key-value pairs and the number of elements of collection type data. This can be done by using the check-keys command line when running Redis-exporter. options to implement.
In addition, we can develop a Lua script to customize the collection of required monitoring data. Then, we use the scripts command line option to let Redis-exporter run this specific script, so as to meet the diverse monitoring needs of the business layer.
Finally, I would like to share two more gadgets with you: redis-stat and Redis Live. Compared with Redis-exporter, these two are lightweight monitoring tools. They are developed in Ruby and Python respectively, and also visually display the instance running status information provided by the INFO command. Although these two tools are rarely updated now, they are good references if you want to develop your own Redis monitoring tools.
In addition to monitoring the running status of Redis, another common operation and maintenance task is data migration. Next, let’s learn about data migration tools.
Sometimes, we need to migrate data between different instances. Currently, one of the more commonly used data migration tools is Redis-shake, which is a tool developed by the Alibaba Cloud Redis and MongoDB teams for Redis data synchronization.
The basic operating principle of Redis-shake is to first start the Redis-shake process, which simulates a Redis instance. Then, the Redis-shake process and the source instance from which the data is migrated perform full data synchronization.
This process is similar to the full synchronization of Redis master-slave instances.
The source instance is equivalent to the main database, and Redis-shake is equivalent to the slave database. The source instance first transfers the RDB file to Redis-shake, and Redis-shake will send the RDB file to the destination instance. Then, the source instance will send the incremental commands to Redis-shake, and Redis-shake is responsible for synchronizing these incremental commands to the destination instance.
The following picture shows the data migration process of Redis-shake:

One of the great advantages of Redis-shake is that it supports multiple types of migration.
First of all, it supports data migration between single instances and cluster-to-cluster data migration.
Secondly, some Redis slicing clusters (such as Codis) will use proxy to receive request operations, and Redis-shake also supports data migration with proxy.
In addition, because Redis-shake is developed by the Alibaba Cloud team, in addition to supporting the open source Redis version, Redis-shake also supports Redis instances under the cloud and Redis on the cloud. Migrating instances can help us achieve the goal of migrating Redis services to the cloud.
After data migration, we usually need to compare whether the data in the source instance and the destination instance are consistent. If there are inconsistent data, we need to find them out, remove them from the destination instance, or migrate the inconsistent data again.
Here, I will introduce you to another data consistency comparison tool, which is Redis-full-check developed by the Alibaba Cloud team.
The working principle of Redis-full-check is very simple, which is to fully compare the data in the source instance and the destination instance to complete the data verification. However, in order to reduce the comparison overhead of data verification, Redis-full-check uses a multi-round comparison method.
In the first round of verification, Redis-full-check will find all the keys on the source instance, and then find the corresponding values from the source instance and the destination instance for comparison. . After the first comparison, redis-full-check will record the data in the destination instance that is inconsistent with the source instance into the sqlite database.
Starting from the second round of verification, Redis-full-check only compares inconsistent data recorded in the database after the end of the previous round.
In order to avoid affecting the normal request processing of the instance, Redis-full-check will pause for a period of time after each round of comparison. As the incremental synchronization of Redis-shake proceeds, the inconsistent data in the source instance and the destination instance will gradually decrease, so we do not need many rounds of verification and comparison.
We can set the number of rounds of comparison ourselves. The specific method is to set the value of the parameter comparetimes to the number of rounds we want to compare when running the redis-full-check command.
After all rounds of comparison are completed, the data recorded in the database is the final difference result between the source instance and the destination instance.
There is something to note here. Redis-full-check provides three comparison modes, which we can set through the comparemode parameter. The comparemode parameter has three values, with the following meanings:
When we apply Redis-full-check, we can choose the corresponding comparison mode according to the business requirements for data consistency. If the consistency requirement is high, set the comparemode parameter to FullValue.
Okay, finally, let me introduce you to CacheCloud, a tool for Redis cluster operation and maintenance management.
CacheCloud is a cloud platform developed by Sohu for Redis operation and maintenance management. It implements master-slave cluster, sentinel cluster and Redis Cluster. Automatic deployment and management, users can operate directly on the platform's management interface.
For common cluster operation and maintenance requirements, CacheCloud provides 5 operation and maintenance operations.
Of course, as an operation and maintenance management platform, CacheCloud not only provides operation and maintenance operations, but also provides a wealth of monitoring information.
CacheCloud will not only collect the real-time running status information of the instance provided by the INFO command for visual display, but also save the running status information of the instance, such as memory usage, number of client connections, and key-value pair data volume. . In this way, when a problem occurs in the operation of Redis, the operation and maintenance personnel can query the saved historical records and conduct analysis based on the running status information at that time.
If you want to have a unified platform to centrally host tasks related to Redis instance management, CacheCloud is a good tool.
In this lesson, I introduced you to several Redis operation and maintenance tools.
We first learned about the INFO command of Redis. This command is the basis of monitoring tools. Monitoring tools will perform secondary processing based on the information provided by the INFO command. We also learned three operation and maintenance tools for monitoring the real-time running status of Redis, namely Redis-exporter, redis-stat and Redis Live.
Regarding data migration, we can either use the Redis-shake tool, or migrate through RDB files or AOF files.
When operating and maintaining Redis, the many open source tools just mentioned can already meet many of our needs. However, sometimes different business lines may have different requirements for Redis operation and maintenance, and directly using ready-made open source tools may not be able to meet all needs. In this case, it is recommended that you conduct secondary development or self-research based on open source tools. , thereby better meeting business usage needs.
For more programming-related knowledge, please visit: Introduction to Programming! !
The above is the detailed content of Share some useful Redis operation and maintenance tools. For more information, please follow other related articles on the PHP Chinese website!
 Commonly used database software
 What are the in-memory databases?
 Which one has faster reading speed, mongodb or redis?
 How to use redis as a cache server
 How redis solves data consistency
 How do mysql and redis ensure double-write consistency?
 What data does redis cache generally store?
 What are the 8 data types of redis