


How to debug remote gdb in vscode? The following article will introduce to you the method of remote gdb debugging of vscode. I hope it will be helpful to you!
Recently, with the guidance of a colleague, I tried using vscode for gdb debugging. After using it, it felt "really good".
Without further ado, what this article is going to achieve is: remote debugging the c code on the linux server and arm embedded device on the windows side, and sorting out the configuration and use of gdb debugging.
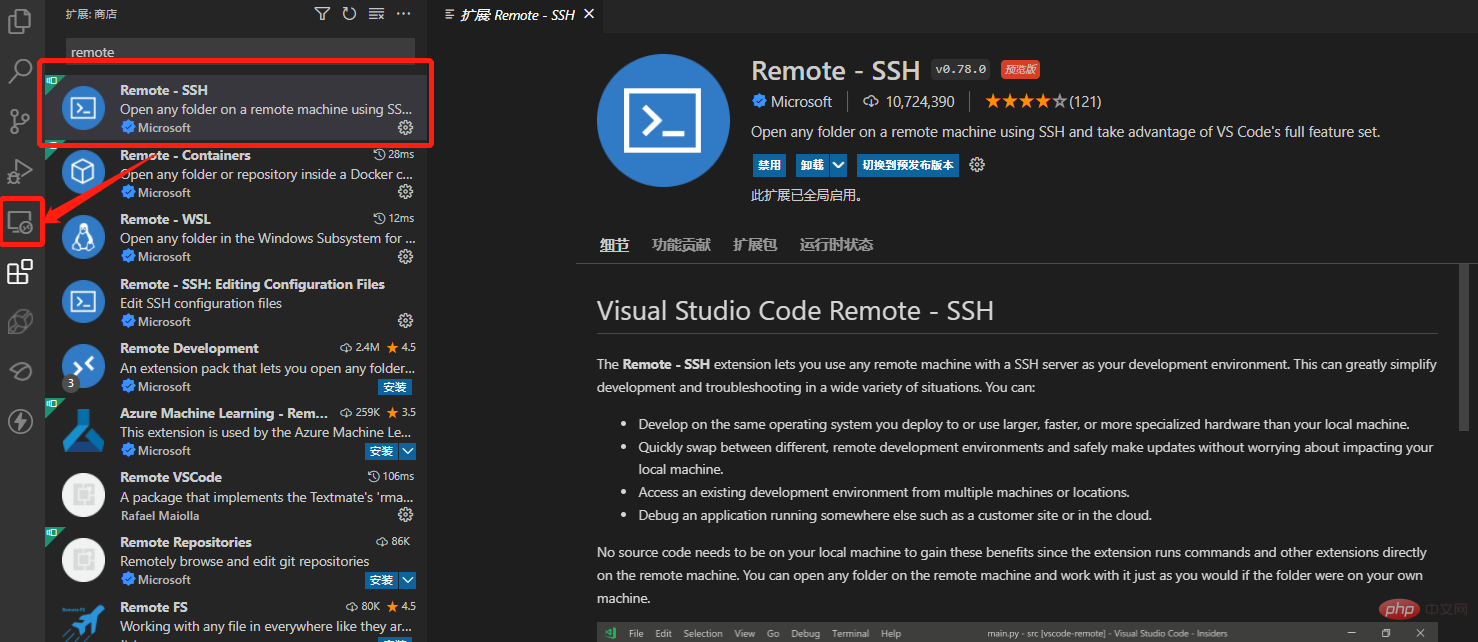
First you need to achieve remote connection to the server, search for "remote-ssh" in the plug-in library, double-click to download and install it (in the picture below I Already installed), after installation, the remote resource manager will appear in the sidebar. [Recommended learning:vscode tutorial,Programming teaching]
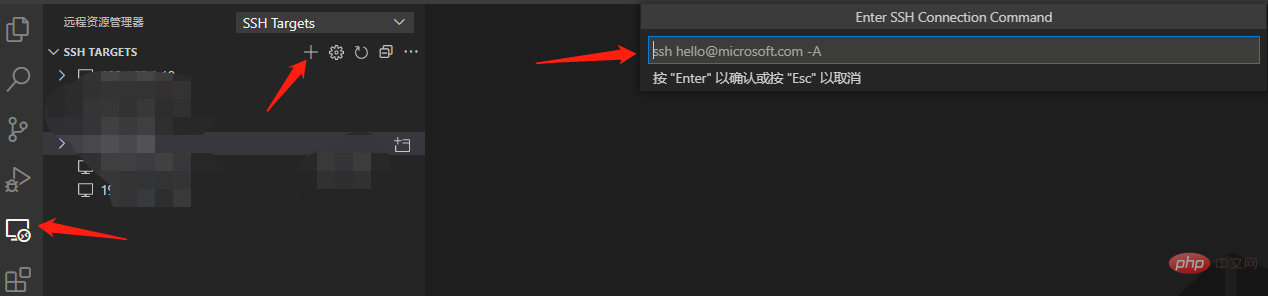
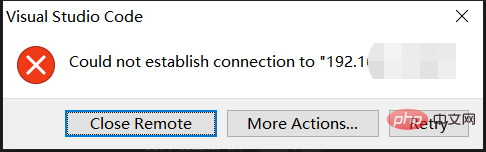
Click the + sign and enter ssh in the pop-up command window to log in command, follow the prompts, enter the password and confirm, the connection will be successful
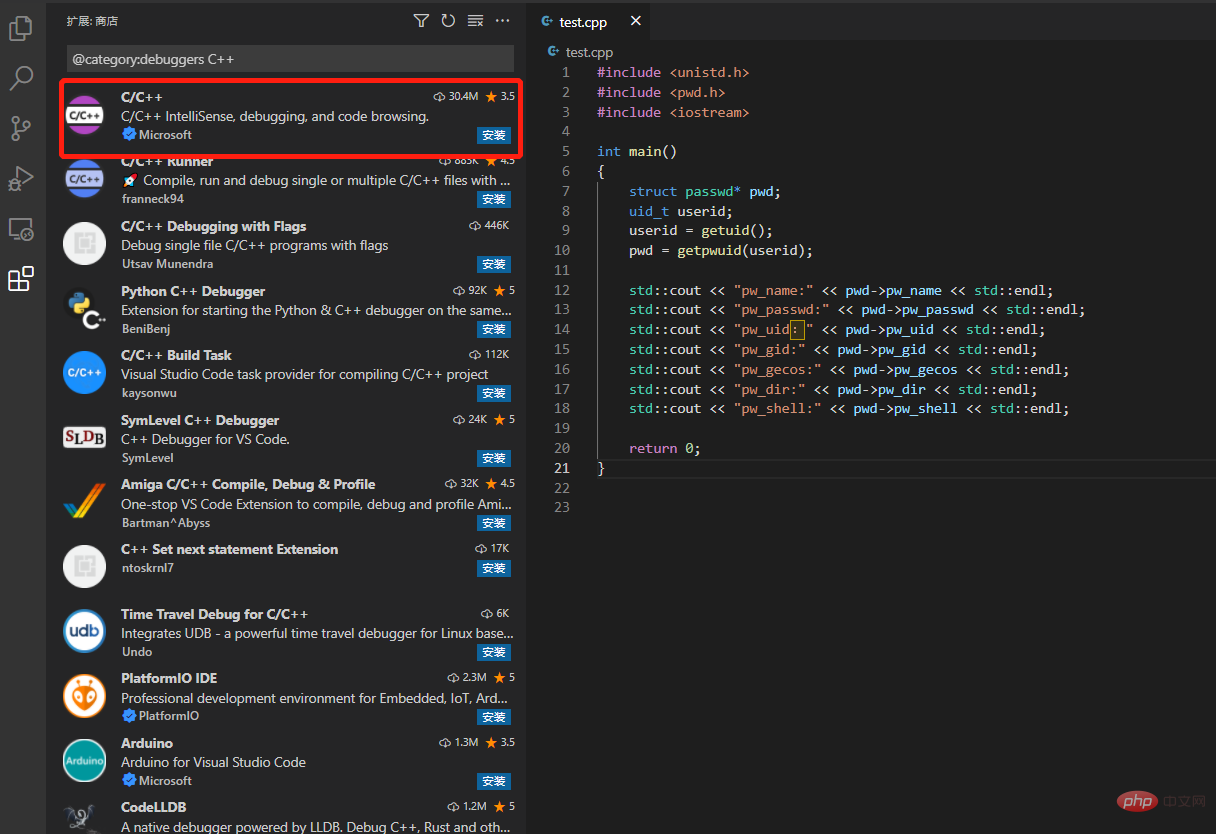
Create on the server A c code, here is the code in "Linux C Get System User Name" as an example, it is very simple
#include#include #include int main() { struct passwd* pwd; uid_t userid; userid = getuid(); pwd = getpwuid(userid); std::cout << "pw_name:" << pwd->pw_name << std::endl; std::cout << "pw_passwd:" << pwd->pw_passwd << std::endl; std::cout << "pw_uid:" << pwd->pw_uid << std::endl; std::cout << "pw_gid:" << pwd->pw_gid << std::endl; std::cout << "pw_gecos:" << pwd->pw_gecos << std::endl; std::cout << "pw_dir:" << pwd->pw_dir << std::endl; std::cout << "pw_shell:" << pwd->pw_shell << std::endl; return 0; }
The compilation method is as follows, be sure to add the -g command, otherwise Unable to debug with gdb
g++ -g test.cpp -o test
Then click File-Open Folder and find the created code path. After confirmation, you can see the code file in the resource manager on the left.
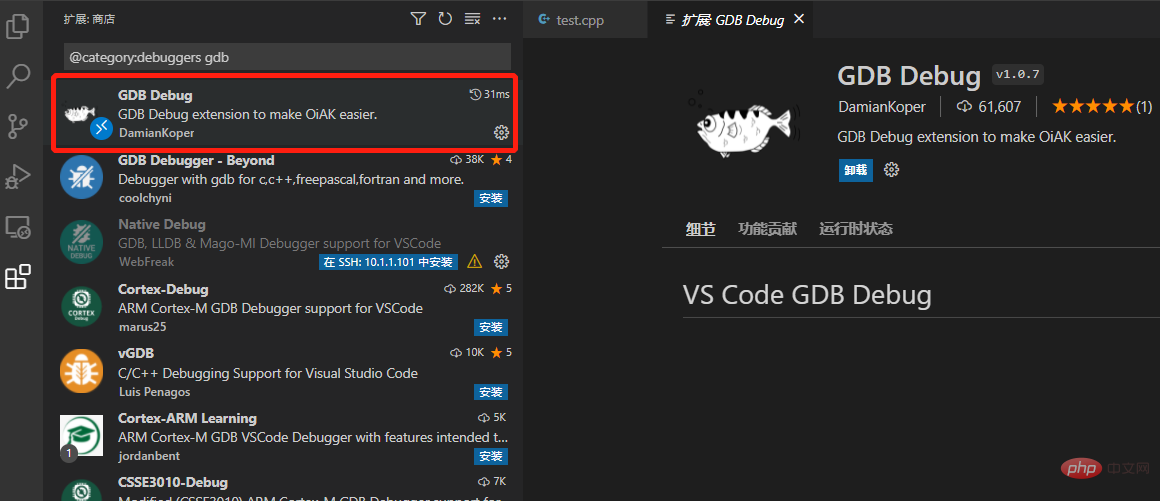
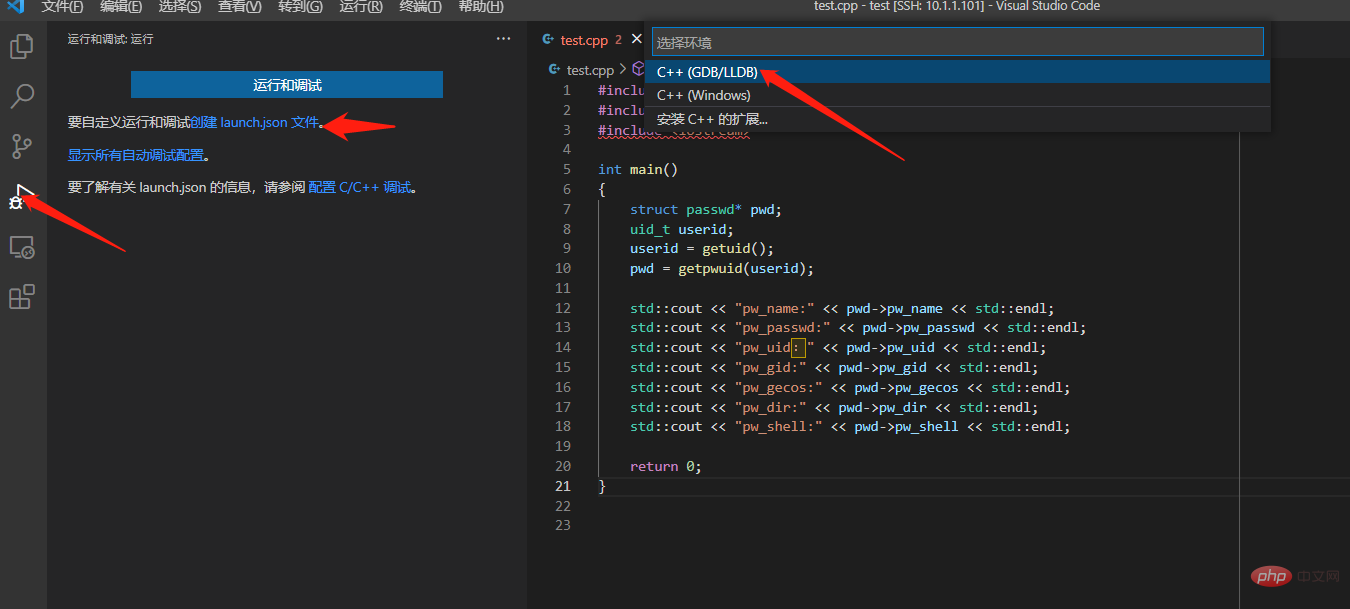
You need to install the c extension for the first run. In the extension page, install C/C
{ // 使用 IntelliSense 了解相关属性。 // 悬停以查看现有属性的描述。 // 欲了解更多信息,请访问: https://go.microsoft.com/fwlink/?linkid=830387 "version": "0.2.0", "configurations": [] }
{ // 使用 IntelliSense 了解相关属性。 // 悬停以查看现有属性的描述。 // 欲了解更多信息,请访问: https://go.microsoft.com/fwlink/?linkid=830387 "version": "0.2.0", "configurations": [ { "name": "(gdb) 启动", //配置名称,显示在配置下拉菜单中 "type": "cppdbg", //配置类型 "request": "launch", //请求配置类型,可以是启动或者是附加 "program": "${workspaceFolder}/test", //程序可执行文件的完整路径,${workspaceFolder}表示远程连接的初始路径 "args": [], //传递给程序的命令行参数 "stopAtEntry": false,//可选参数,如果为true,调试程序应该在入口(main)处停止 "cwd": "${workspaceFolder}", //目标的工作目录 "environment": [], //表示要预设的环境变量 "externalConsole": false,//如果为true,则为调试对象启动控制台 "MIMode": "gdb",//要连接到的控制台启动程序 "setupCommands": [ //为了安装基础调试程序而执行的一个或多个GDB/LLDB命令 { "description": "为 gdb 启用整齐打印", "text": "-enable-pretty-printing", "ignoreFailures": true } ] } ] }
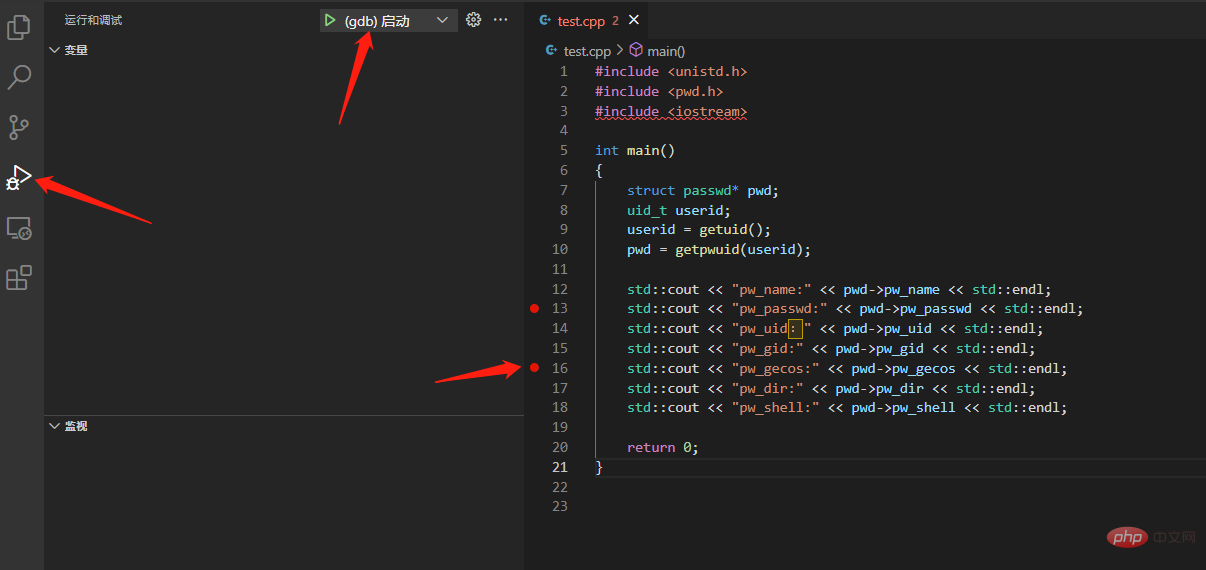
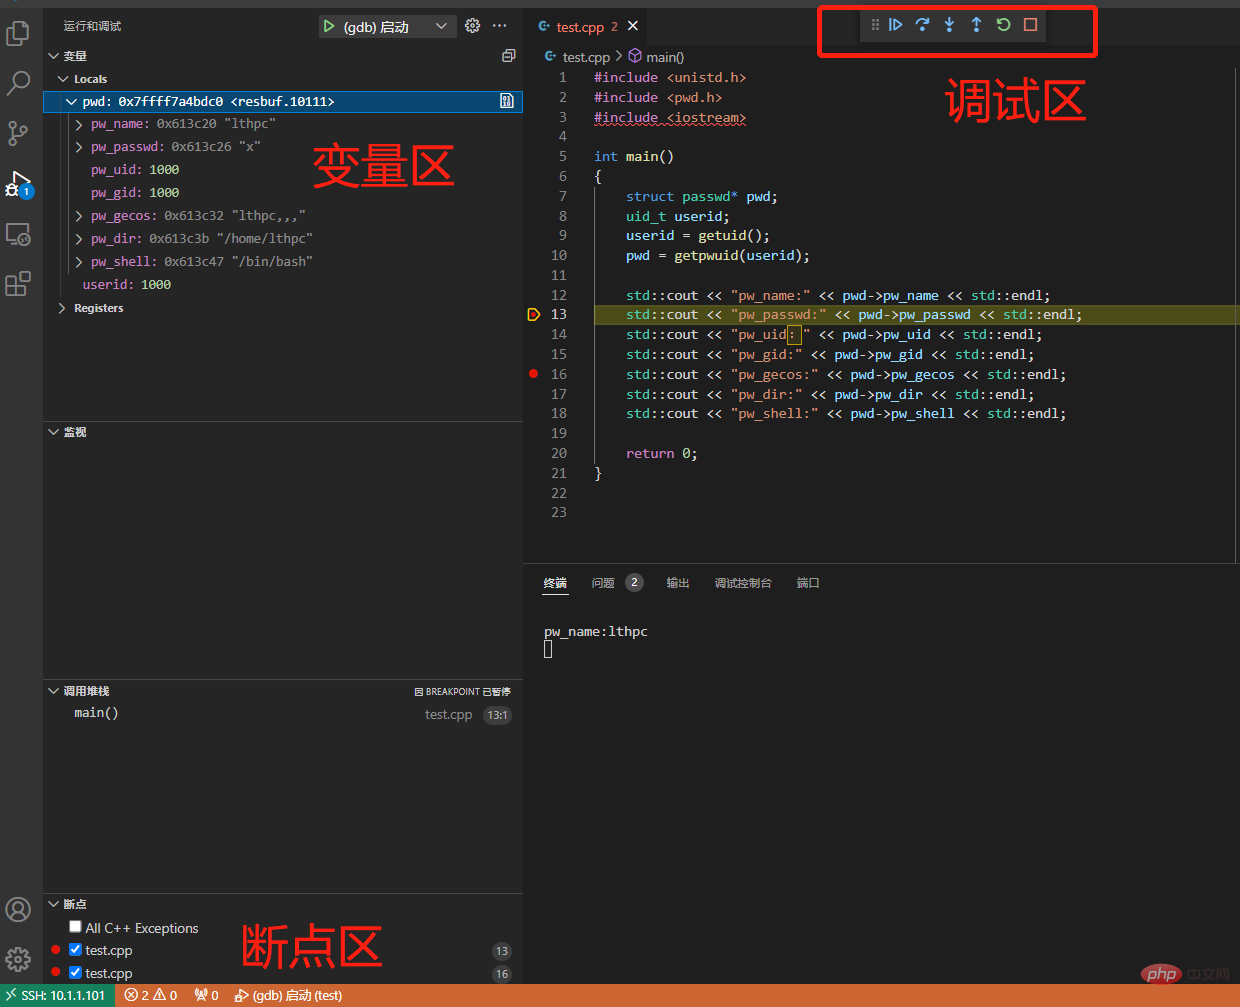
F5 Start debugging F10 Single step skip F11 Single step debugging shift F11 Single step out ctrl shift F5 Restart debugging shift F5 Stop debugging
vscodeBasic Tutorial!
The above is the detailed content of How to debug remote gdb in vscode? Detailed explanation of method. For more information, please follow other related articles on the PHP Chinese website!


![[Web front-end] Node.js quick start](https://img.php.cn/upload/course/000/000/067/662b5d34ba7c0227.png)


