Found a total of 10000 related content

Development and debugging of Vue statistical chart plug-in
Article Introduction:Introduction to the development and debugging of Vue statistical chart plug-in: In modern web development, statistical charts are very common components. They can be used to visualize data, making it easier to understand and analyze. As a popular front-end framework, Vue provides many powerful tools and libraries, including plug-ins for developing and debugging statistical charts. This article will introduce how to use Vue to develop and debug a simple statistical chart plug-in, and provide some code examples. Preparation First, we need a Vue project. Can use Vue
2023-08-17
comment 0
1742

Loading and performance optimization of Vue statistical chart plug-in
Article Introduction:Summary of loading and performance optimization of Vue statistical chart plug-in: Statistical charts are one of the common functions in web applications. The Vue framework provides many excellent plug-ins for rendering statistical charts. This article will introduce how to load and optimize the performance of the Vue statistical chart plug-in, and give some sample code. Introduction: With the popularity of Web applications, data visualization has become one of the focuses of attention in all walks of life. As an important form of data visualization, statistical charts can help users better understand and analyze data. In the Vue framework, there are many excellent
2023-08-18
comment 0
942

How to implement dynamically generated statistical charts under the Vue framework
Article Introduction:How to implement dynamically generated statistical charts under the Vue framework. In modern web application development, data visualization has become an indispensable part. And statistical charts are an important part of it. The Vue framework is a popular JavaScript framework that provides rich features for building interactive user interfaces. Under the Vue framework, we can easily implement dynamically generated statistical charts. This article will introduce how to use the Vue framework and third-party chart libraries to achieve this function. To implement dynamically generated statistical charts
2023-08-18
comment 0
1689

How to use PHP arrays to generate and display charts and statistical graphs
Article Introduction:How to use PHP arrays to generate and display charts and statistical graphs. PHP is a widely used server-side scripting language with powerful data processing and graphic generation capabilities. In web development, we often need to display charts and statistical graphs of data. Through PHP arrays, we can easily implement these functions. This article will introduce how to use PHP arrays to generate and display charts and statistical graphs, and provide relevant code examples. Introducing the necessary library files and style sheets Before starting, we need to introduce some necessary library files into the PHP file
2023-07-15
comment 0
1980

How to use Vue to implement dynamically generated statistical charts
Article Introduction:Overview of how to use Vue to implement dynamically generated statistical charts: In modern web development, data visualization is a very important direction. Statistical charts are a common form of data visualization, mainly used to display the distribution, trends and correlations of data. Vue is a popular front-end development framework. Combined with its flexible data binding and componentization features, we can easily implement dynamically generated statistical charts. Preparation work First, we need to introduce Vue and a suitable chart library into the project. In this article, we choose to use E
2023-08-18
comment 0
1390

How to use PHP and Vue.js to generate beautiful statistical charts
Article Introduction:How to use PHP and Vue.js to generate beautiful statistical charts. In modern web development, data visualization is a very important part. Displaying data through charts can make the data more intuitive and easier to understand. This article will introduce how to use PHP and Vue.js to generate beautiful statistical charts, and demonstrate the specific implementation through code examples. Preparation Before starting, you need to make sure that you have installed PHP and Vue.js and have basic programming knowledge. In addition, you also need to download a suitable chart library. This article will
2023-08-17
comment 0
1144

How to use php interface and ECharts to generate visual statistical charts
Article Introduction:In today's context where data visualization is becoming more and more important, many developers hope to use various tools to quickly generate various charts and reports so that they can better display data and help decision-makers make quick judgments. In this context, using the Php interface and ECharts library can help many developers quickly generate visual statistical charts. This article will introduce in detail how to use the Php interface and ECharts library to generate visual statistical charts. In the specific implementation, we will use MySQL
2023-12-18
comment 0
1119

How to use Vue to implement statistical charts generated by reports
Article Introduction:How to use Vue to implement statistical charts for report generation Introduction: With the continuous development of Internet technology, data analysis and visualization have become an important part of enterprise management and decision-making. The production of reports is one of the effective ways to communicate and display the results of data analysis. This article will introduce how to use Vue to implement statistical charts generated by reports, and demonstrate the implementation process through code examples. 1. Preparation work: Before starting to write code, we need to prepare the following environment: Install Vue: You can use the npm command to install it. The specific command is: npm
2023-08-17
comment 0
1368

How to generate interactive statistical charts through the php interface and ECharts
Article Introduction:In modern applications, visualization of data is becoming more and more popular. Statistical charts are a great way to visualize data and can easily help users understand trends in data. ECharts is a powerful front-end chart framework that provides rich chart types and interactive functions. Php is a very popular backend language that makes it easy to generate dynamic content and interfaces. In this article, we will introduce how to use the PHP interface and ECharts to generate interactive statistical charts, and provide specific code examples. one,
2023-12-18
comment 0
991

How to generate adaptive statistical charts through the php interface and ECharts
Article Introduction:How to generate adaptive statistical charts through the PHP interface and ECharts. With the rapid development of the Internet and the advent of the big data era, data visualization has become one of the important ways for us to obtain and display data. As an excellent data visualization library, ECharts has become one of the tools of choice for many developers. This article will introduce how to generate adaptive statistical charts through the PHP interface and ECharts, and provide specific code examples. Confirm the project environment. First, make sure that p has been installed in your project environment.
2023-12-18
comment 0
651
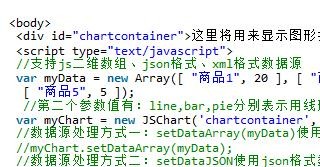
Introduction to the use of JsChart component
Article Introduction:What is JsChart? JSChart can generate icons on web pages, which are often used for statistical information. It is a very easy-to-use JS component.
2018-03-06
comment 0
1199


Implementation of pie chart and radar chart functions in Vue statistical charts
Article Introduction:Implementation of the pie chart and radar chart functions of Vue statistical charts Introduction: With the development of the Internet, the demand for data analysis and chart display is becoming more and more urgent. As a popular JavaScript framework, Vue provides a wealth of data visualization plug-ins and components to facilitate developers to quickly implement various statistical charts. This article will introduce how to use Vue to implement the functions of pie charts and radar charts, and provide relevant code examples. Introducing statistical chart plug-ins In Vue development, we can use some excellent statistical chart plug-ins to help us implement
2023-08-18
comment 0
1637

How to use Vue statistical chart plug-in and examples
Article Introduction:How to use the Vue statistical chart plug-in and examples Introduction: When developing web applications, statistical charts are very useful data visualization tools. Vue.js is a popular JavaScript framework that provides many convenient plugins and tools for creating interactive statistical charts. This article will introduce how to use the statistical chart plug-in using Vue.js and provide some code examples. 1. Install the Vue statistical chart plug-in. Before starting, we need to make sure that Vue.js has been installed. Then we can make
2023-08-25
comment 0
1431

How to use php interface and ECharts to generate responsive statistical charts
Article Introduction:How to use PHP interface and ECharts to generate responsive statistical charts. With the continuous development of Internet technology, data analysis has become an indispensable part of our lives. Making some practical statistical charts is also an indispensable method in data analysis. In this article, we will introduce how to use the PHP interface and ECharts to generate responsive statistical charts, so that we can quickly create visual data analysis charts. 1. Environment setup Before using PHP and ECharts to generate statistical charts, you need to
2023-12-17
comment 0
880

How to generate a table of contents in word2003
Article Introduction:Open the word2003 document and set the text you want to generate a table of contents as a unified title, as shown in the figure. 2. Click the mouse where you want to insert the table of contents and select the menu bar [Insert] - [Reference] - [Index and Table of Contents] , as shown in the figure. In the pop-up dialog box, select [Directory Tab], select the symbol before the tab character..., and then click OK, as shown in the figure. View the effect of automatically generating a directory.
2024-06-05
comment 0
931

How to use ECharts and php interface to generate statistical charts
Article Introduction:How to use ECharts and PHP interfaces to generate statistical charts Introduction: In modern web application development, data visualization is a very important link, which can help us display and analyze data intuitively. ECharts is a powerful open source JavaScript chart library. It provides a variety of chart types and rich interactive functions, and can easily generate various statistical charts. This article will introduce how to use ECharts and PHP interfaces to generate statistical charts, and give specific code examples. 1. Overview of ECha
2023-12-18
comment 0
785
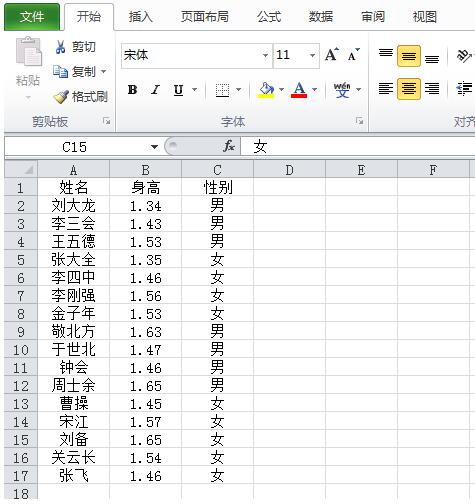
Detailed tutorial on making intuitive statistical charts in Excel tables
Article Introduction:1. First, enter the data to be counted into Excel in rows or columns. 2. Select all content, click the menu bar and insert button. Select the PivotTable report. 3. The default is the new worksheet, click OK. 4. Select the fields to add the table. Select all three fields here. At this time, various statistical graphics appear in the menu bar, click on the graphics we want. 5. Click the polyline graph inserted under the menu bar to automatically generate a polyline graph. 6. Filter data according to different purposes of use. If you want to keep only the number of boys, uncheck the box in front of girls.
2024-03-30
comment 0
680
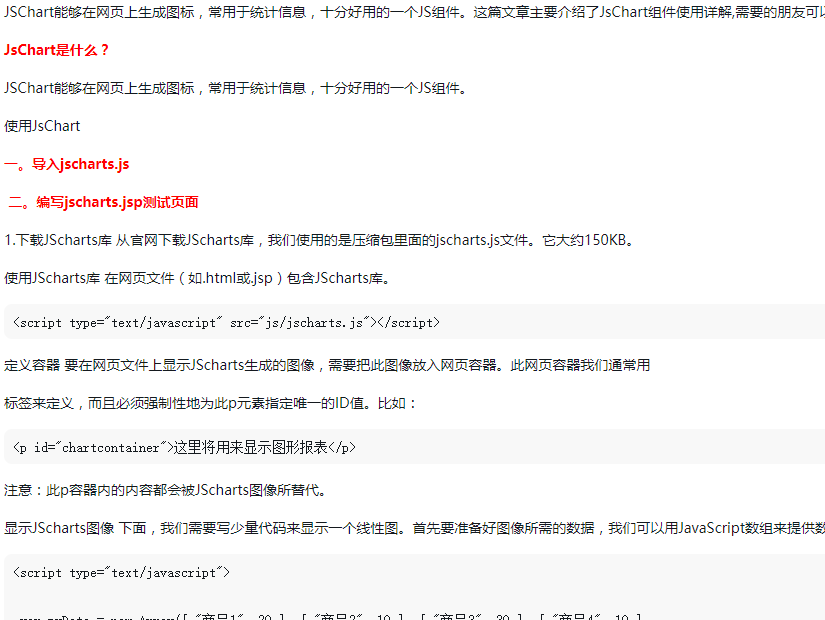
Detailed introduction to the usage and functions of JsChart component
Article Introduction:JSChart can generate icons on web pages, which are often used for statistical information. It is a very easy-to-use JS component. This article mainly introduces the detailed explanation of the use of JsChart component. Friends in need can refer to it.
2018-06-01
comment 0
1510

Optimization of bubbles and fireworks special effects for Vue statistical charts
Article Introduction:Optimization of bubbles and fireworks special effects in Vue statistical charts Introduction: With the rapid development of the mobile Internet, data visualization has become one of the important means of displaying data. In data visualization, statistical charts can not only display data concisely, but also improve user experience. In the Vue framework, by using plug-ins and components, we can quickly implement various statistical charts, and optimize them to make them more vivid and attractive. This article will take bubble charts and fireworks effects as examples to introduce how to optimize the presentation of statistical charts in Vue. one,
2023-08-18
comment 0
1350


