Found a total of 10000 related content
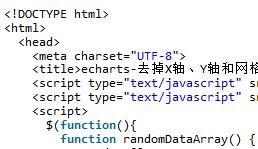
Share an example of how echarts implements the effect of removing the X-axis, Y-axis and grid lines
Article Introduction:This article mainly introduces the effect of removing the X-axis, Y-axis and grid lines implemented by the jQuery plug-in echarts. It analyzes the operation skills of the echarts plug-in for drawing table diagrams and setting graphics-related properties in the form of examples. It also comes with demo source code for readers to download and refer to. Friends can refer to it, I hope it can help everyone.
2018-01-23
comment 0
6852

How to insert excel table link in ppt2013
Article Introduction:Open ppt, locate the place where you want to insert the excel table, click Insert -----Object on the common toolbar. In the [Insert Object] dialog box that pops up, select [Create from File] and click Browse to find the object you want to place. In order to display the excel table file in the form of an icon in PPT, you need to select [Display as Picture] here. The final effect is as shown in the figure. You can drag the excel icon to change its position.
2024-04-17
comment 0
1110

How to solve the problem that the background is black when printing contract photos in Word?
Article Introduction:At work, many of the contract documents we obtain are often sent by users taking photos, and most of these contracts are in the form of photos, and the printed effect is not as good as the original document! Take the picture above as an example. The effect of taking a photo to print the contract is very poor. The background is all black. It is very different from the original document. Many people may use it reluctantly. Today, we will teach you how to solve this problem and ensure that the printed effect is exactly the same as the original document! 01. Remove the black background 1. First insert the photo into Word, "Insert" - "Illustration" - "Picture", then select the photo and set a wrapping method. Here I choose "Float above the text" ”. 2. Select the photo and enter "Format" - "Adjustment" - "Correction" - "Picture Correction"
2023-11-13
comment 0
2093

Optimization of 3D stereoscopic and rotation effects for Vue statistical charts
Article Introduction:Optimization of 3D stereoscopic and rotation effects of Vue statistical charts In the field of data visualization, statistical charts are one of the very important tools. It can transform complex data into a visual form, making it easier for people to understand and analyze the data. In the Vue framework, we can realize the display and operation of statistical charts by introducing some excellent plug-ins. This article will take a histogram as an example to introduce how to use the echarts plug-in in Vue to optimize the 3D stereoscopic and rotation effects of statistical charts. First, we need to install echarts
2023-08-26
comment 0
1632

How to add text mask animation in Ae How to add text mask animation in Ae
Article Introduction:1. First, after opening the Ae software interface, create a new synthesis setting. 2. Then, press the Ctrl+i keys on the keyboard to import the picture, and drag the mouse to pull the material into the timeline panel. 3. Then, press the Ctrl+T keys on the keyboard to enter text in the image. 4. Finally, use the rectangle tool to draw a rectangle, move the layer below the text layer, add a blinds effect with a direction expression of time*40, and press the F9 key on the keyboard to set the animation ease-in and ease-out effect. That's it.
2024-05-09
comment 0
1013
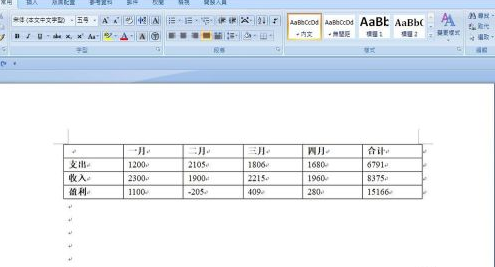
How to create a column chart in Word - steps to create a column chart in Word
Article Introduction:Word software is indispensable for many users in their office, so do you know how to create a column chart in Word? The following article brings you the steps to create a column chart in Word. Interested users can come and learn together. Open the Word document. Choose Insert - Chart, select one of the column charts, and click OK. An excel table pops up. as the picture shows. The inserted column chart is shown in the figure. Copy the table contents to the open excel sheet. The column chart in the Word document has changed as the contents of the excel table change. The effect is shown in the figure.
2024-03-04
comment 0
1218

What does layer mean in ps
Article Introduction:Layers are like films containing elements such as text or graphics. They are stacked one on top of another in order to form the final effect of the page. Layers allow precise positioning of elements on the page. Text, pictures, tables, and plug-ins can be added to layers, and layers can also be nested inside.
2019-05-29
comment 0
35693
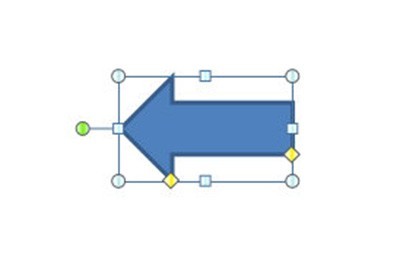
How to create a big carousel lottery effect using PPT
Article Introduction:First, make a large turntable pointer. We first insert an arrow shape with any color. Duplicate this arrow, flip it so that it faces the opposite direction of the first arrow, and set its fill to no fill to hide it. Finally combine the two shapes together. Then we add a rotation animation to the pointer. The specific operation is to customize the animation, [Add Animation]-[Emphasis]-[Spiral Support], and then the duration is 0.2 seconds. Then check the box above to automatically set the slide animation effect to 0 seconds. The slideshow option is to loop. Finally, add the copywriting on the large plate, and the turntable lottery effect is completed. Press F5 to start the show, and press 1 to pause the pointer.
2024-04-17
comment 0
1171

How to make a large PPT turntable_a few steps
Article Introduction:First we make a large turntable pointer. We first insert an arrow shape with any color. Then we duplicate this arrow, flip it so that it faces the opposite direction of the first arrow, and set its fill to no fill to hide it. Finally combine the two shapes together. Then we add a rotation animation to the pointer. The specific operation is to customize the animation, [Add Animation]-[Emphasis]-[Spiral Support], and then the duration is 0.2 seconds. Then check the box above to automatically set the slide animation effect to 0 seconds. The slideshow option is to loop. Finally, we add the copywriting on the large plate, and the turntable lottery effect is completed. Press F5 to start the show, and press 1 to pause the pointer. How about a homemade big carousel lottery?
2024-04-26
comment 0
709

Usage of \t in c++
Article Introduction:\t in C++ is an escape character that represents a horizontal tab character and is used to insert a tab character into text, with an effect similar to pressing the Tab key on the keyboard. \t can be used directly in the string, or using the escape sequence "\t". It can also be used for file manipulation, formatted output, and as part of other escape sequences.
2024-04-26
comment 0
1097

Compute all permutations of integers that form an acyclic graph according to given conditions
Article Introduction:Counting the stages within an integer N, forming an acyclic graph requires investigating every possible variation and checking whether they form an acyclic graph according to a given condition. These conditions may be related to the structure of coordination graphs formed by changes, where the absence of cycles indicates acyclicity. This problem involves concepts from graph theory and can be solved by depth-first search or dynamic programming. Depth-first search works by investigating each stage recursively, and dynamic programming optimizes loops by storing intermediate results. The number of valid stages at last count shows the number of ways in which an integer N can be organized into an acyclic graph that satisfies predetermined conditions. Methods used Depth-first search (DFS) Dynamic programming Depth-first search (DFS) in generating groupings with a given operation In the DFS method, I
2023-09-07
comment 0
940

How to mosaic PPT_Introduction to how to mosaic PPT
Article Introduction:PPT itself does not directly provide built-in "mosaic" functionality, but similar effects can be achieved through some tricks or plug-ins. Friends who want to know the specific operation can come and take a look with the editor! How to mosaic PPT 1. First, click the "Insert" tab, then select "Shape" and click "Rectangle" in the pop-up drop-down menu. 2. Next, double-click the inserted shape and open the "Object Properties" menu on the right. 3. In the object property settings, select the "Fill" option, and then click "Pattern Fill". In the pattern list, you can find mosaic-like patterns. After selecting the pattern, you can set the scale and color to adjust the size and color of the mosaic effect. 4. Move the adjusted mosaic shape and cover it until you want it to be blurry or
2024-06-04
comment 0
1013

How to add barcode in access form access barcode generation tutorial
Article Introduction:After opening access, click Create | Form | Blank Form to create a new blank form. Enter the [Design] tab in the form layout tool, click [Other] in the control. When the form is in layout view, the [ActiveX Control] option under Others is gray, as shown in the figure below, and cannot be operated. Click the left [Design View] in the side view drop-down option enters the form design mode, so that ActiveX controls can be used. Find BarCodeControl in the pop-up [Insert ActiveX Control] window, and then click [OK] to insert a barcode into the form. ,Results as shown below. Click the [Attribute Table] button above to set various attributes of the barcode in the attribute table.
2024-06-01
comment 0
1246

How to add accessibility features to Vue
Article Introduction:With the continuous development of front-end frameworks, Vue, as one of the representatives, plays an important role in front-end development. Vue has the advantages of being easy to learn, flexible, and high-performance. However, the basic functions of Vue are limited. If you want to implement more complex functions, you need to add some auxiliary functions. This article will introduce how to add Vue's auxiliary functions to meet different development needs. 1. Introduce Vue plug-in Vue plug-in is a form of realizing Vue functions. Vue officially provides some commonly used plug-ins, such as Vue-Router, Vue
2023-04-26
comment 0
849

C++ syntax error: the while loop body is missing curly braces, how to deal with it?
Article Introduction:C++ is an efficient programming language, but syntax errors are inevitable when writing code. One common mistake is missing curly braces in the body of a while loop. This article explains the causes of this error and how to deal with it. 1. Reason In C++, the while statement is used to execute a piece of code in a loop when a certain condition is met. The correct syntax is: while(condition){//codeblock} where condition is a Boolean expression, if
2023-08-22
comment 0
2090
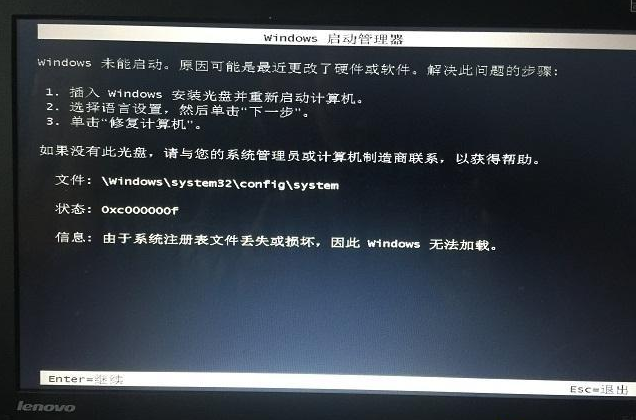
What to do if win7 system registry is damaged and cannot be started
Article Introduction:If your computer fails to load when you choose to reinstall the system or because the system registry file is missing or damaged, the file is missing or damaged, which is mainly caused by system damage, you can try the following methods to solve this problem. Generally speaking, if the message in the image above appears when your computer starts up, it is caused by a damaged or incomplete system. The final solution to this problem simply involves reinstalling the system. Due to the complexity of Windows system files, it is generally not suitable to repair them through the registry. Reinstallation is the most thorough and effective solution. 1. Download Xiaobai’s one-click system reinstallation tool (www.xiaobaixitong.com), and then create a bootable USB disk. 2. Insert the USB disk to boot
2023-07-17
comment 0
5185
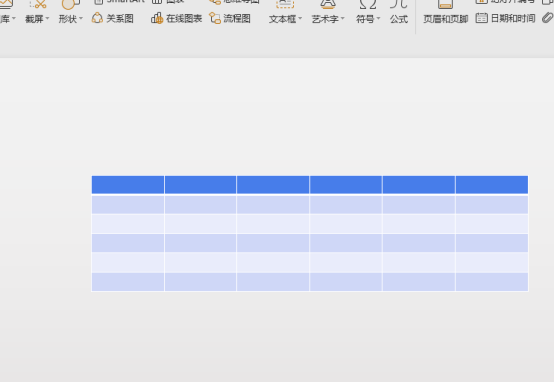
How to make ppt table
Article Introduction:In the ppt presentation, in order to enrich the content of the presentation, we can insert files in various formats, such as inserting fonts, pictures and tables. ppt is a reporting form that is often used nowadays. Various files are used to express the content. Let’s do it together Take a look at the specific method of ppt table. Step 1: Determine the form production requirements. Table: There are 6 columns vertically and 6 rows horizontally. Step 2: Adjust the table size. At the red circle No. 1, hold down the left mouse button to adjust the vertical spacing of the table. At the red circle No. 2, hold down the left mouse button to adjust the vertical and horizontal spacing of the table at the same time. If you hold down the Shift key on the keyboard at the same time, the table can be enlarged or reduced in equal proportions. At the red box No. 3, hold down the table line with the left mouse button and move up or down to adjust the spacing of the first row of tables.
2024-03-21
comment 0
558


