Found a total of 10000 related content

How to set the color of a progress bar using HTML and CSS?
Article Introduction:In website development, progress bars are an important part of the website. The progress bar shows the progress of the process. With the help of it, users can see the status of the work being done on the website, including load times, file uploads, file downloads, and other similar tasks. By default, it is gray. However, to make progress bars stand out and be visually appealing, you can use HTML and CSS to change their color. What is a progress bar? A progress bar is used to show the progress of a task. It is a graphical user interface element. It basically consists of a horizontal bar that gradually fills in as the task progresses, accompanied by a percentage value or other completion indicator. Progress bars are used in web applications to provide users with information about completing a process such as file upload, file download, or software installation.
2023-09-19
comment 0
1376

Detailed steps for making long shadow data charts from PPT documents
Article Introduction:1. Open the PPT application, create a new slide, and select a blank layout. Right-click to set the background format, set to gradient fill, linear 90 degrees, two apertures, the first color is: white background 1 dark 5%, the second color is white background 1 dark 15%, the background is set. 2. Click the Insert command, find the column chart, stacked column chart, and click Insert, so that a stacked column chart is inserted into the PPT. 3. The system automatically generates a column chart with four categories and three series. Actually we need two series to make this chart. Therefore, select Series 3, which is the gray series, and right-click to delete. 4. We use Series 1 to display the size of the data and Series 2 to make the bars. Therefore, we first need to edit the data so that the bar data becomes
2024-03-26
comment 0
557

Method to implement jquery-file-upload file upload with progress bar effect
Article Introduction:jQuery File Upload is a Jquery image upload component that supports multi-file upload, cancellation, deletion, thumbnail preview before upload, list display of image size, upload progress bar display, and server-side support for various dynamic language development. This article mainly introduces the effect of jquery-file-upload file upload with progress bar. The code is divided into html part, css part and js part. It is very good and has reference value. Friends who need it can refer to it. I hope it can help everyone.
2017-12-19
comment 0
3571

Compute all permutations of integers that form an acyclic graph according to given conditions
Article Introduction:Counting the stages within an integer N, forming an acyclic graph requires investigating every possible variation and checking whether they form an acyclic graph according to a given condition. These conditions may be related to the structure of coordination graphs formed by changes, where the absence of cycles indicates acyclicity. This problem involves concepts from graph theory and can be solved by depth-first search or dynamic programming. Depth-first search works by investigating each stage recursively, and dynamic programming optimizes loops by storing intermediate results. The number of valid stages at last count shows the number of ways in which an integer N can be organized into an acyclic graph that satisfies predetermined conditions. Methods used Depth-first search (DFS) Dynamic programming Depth-first search (DFS) in generating groupings with a given operation In the DFS method, I
2023-09-07
comment 0
924

Solution to illegal input value in excel
Article Introduction:Solution to illegal input value in Excel: 1. Check whether the entered value meets the requirements, and set a warning or error prompt in Excel through conditional formatting or data verification function to remind the user to re-enter the correct value; 2. Use the data verification function to Set constraints such as the range, type, and length of the value, and Excel will automatically give an error message; 3. Use the IF function to make conditional judgments, and provide corresponding processing methods based on the results of the conditions; 4. Use conditional formatting to mark, so that Illegal values are displayed in different styles.
2023-08-18
comment 0
15644

Detailed method of placing insertion point in MathType
Article Introduction:The insertion point mark in MathType is different from the insertion point mark used in Word text, because in addition to a flashing vertical line, the insertion point in the formula editor also has another flashing horizontal line below the formula. line. The intersection of the two lines as shown in the picture is the insertion point in the formula editor. When selecting the insertion point in the formula editor, you must be in editing mode. You can use the following methods to place the insertion point: 1. Click the insertion method with the mouse: You can select it with the mouse just like in a Word document. However, because the space for the insertion point in the equation editor is often very small, when selecting the insertion point with the mouse, hold down the Ctrl key to change the pointer into a small upward arrow, and then click method to place the insertion point. 2. use
2024-04-16
comment 0
621

How to set dynamic wallpaper on TikTok
Article Introduction:I believe many users on Douyin have seen various dynamic wallpaper covers, so how can we set the dynamic wallpaper display? Below, the editor will bring you a graphic tutorial on how to set up Douyin dynamic wallpaper, let’s take a look. Douyin usage tutorial: How to set dynamic wallpaper on Douyin 1. First, after we open Douyin, click the video forward button as shown in the picture on the homepage. 2. We click on the dynamic wallpaper option as shown in the picture in the forwarding interface. 3. When we see the plug-in installation prompt popping up, click Install Now. 4. Then we click on the three-bar icon in the upper right corner of the personal interface, as shown in the picture. 5. Then we click on the setting option as shown in the picture. 6. Finally, we click on the dynamic wallpaper in General in the settings interface, and then select the dynamic wallpaper in the settings.
2024-03-26
comment 0
1120

XML Volume Practical Tips (5): Structure Tree Diagram
Article Introduction:I first thought of making a binary tree because I needed to make a company structure chart. The previous approach was to draw a picture directly using graphics software. It looks great, but you need to paint a new one every time there are changes. On the other hand, the display and layout of lines on web pages are quite limited. Typesetting and positioning based on dynamically generated data are very difficult, and the aesthetics are not satisfactory. After making various attempts, I decided to use XML+XSL for data operations; use VML to beautify lines, and use JAVASCRIPT to position objects.
2017-02-10
comment 0
1648

Horizontal ruler can be displayed in word document in three view modes
Article Introduction:There are three view modes that can display the level ruler in Word. There are four view modes in 2003, as follows: There are four views in Word, among which page view is the most commonly used. Page view displays the document in page form, retaining all graphical objects, so it is very convenient to use. In normal view, paging is represented by a dotted line. Graphic objects, inserted page numbers, headers, and footers cannot be displayed. Vertical typesetting is not possible. Mainly used for text input, editing and viewing pure text documents. Web layout view: The biggest advantage of Web layout view is the convenience of online reading. It does not display the text in the actual printed effect, but displays the text larger and makes the paragraphs automatically wrap to fit the size of the current window, and only it can Add document background color and
2024-01-13
comment 0
1700
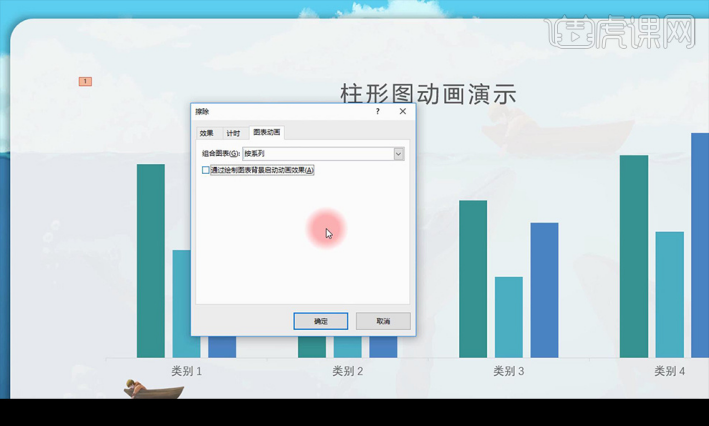
How to make dynamic ppt?
Article Introduction:Are you still worried about not being able to make dynamic ppt? Don't worry, today I will show you how to make dynamic ppt. Sometimes, when I see dynamic ppts made by others, I am really envious. No matter how beautifully you make your ppt, it will look very boring compared to the dynamic ppt made by others. If only I could learn to make dynamic ppts. After repeated research, I finally mastered the skills of making dynamic PPT. Now, I can’t wait to share this great news with you. Next, let’s explore how to create icons in dynamic PPT! The specific steps are as follows: 1. For the animation effect of the chart, we first add the [Erase] animation to the column chart and adjust the [Chart Animation] parameters as shown in the figure. 2. We can also order
2024-03-20
comment 0
1251

Recommended 5 articles about actual combat bags
Article Introduction:Motivation: I first thought of making a binary tree because I needed to make a company structure chart. The previous approach was to draw a picture directly using graphics software. It looks great, but you need to paint a new one every time there are changes. On the other hand, the display and layout of lines on web pages are quite limited. Typesetting and positioning based on dynamically generated data are very difficult, and the aesthetics are not satisfactory. After making various attempts, I decided to use XML+XSL for data operations; use VML to beautify lines, and use JAVASCRIPT to position objects. Material: There are 2 structures of the XML roll ...
2017-06-15
comment 0
2137

What are the hidden system processes of mobile phones?
Article Introduction:What does it mean to hide system processes on a mobile phone? It's just that you don't check the software processes running on your phone in the settings, there's no other meaning. To give an example that is not particularly appropriate, if you are copying files on your computer, you can drag the progress bar in front of the interface of other software. Let’s call this action display process. If you are using other software and the copy progress bar is blocked, It can be called a hidden process. How to hide programs in win10? The method of hiding processes in win10 is divided into the following two steps: 1. After entering the system, right-click the taskbar and select "Properties". 2. Click the "Start Menu" item and click the "Customize" button. Then click "Choose which icons appear on the taskbar." Click "Off" to hide the preface.
2024-01-12
comment 0
850

pace.js – Web page automatic loading progress bar plug-in
Article Introduction:Introduce Pace.js into the page, and the page will automatically monitor your requests (including Ajax requests). When the event loop lags, the loading status and progress will be recorded on the page. This plug-in has good compatibility and is compatible with all mainstream plug-ins above IE8. What’s more, its power is that you can also introduce the theme style of the loading progress bar. You can choose any color and multiple animation effects (such as simplicity, flash , MAC OSX, left padding, top padding, counter and bounce, etc. animation effects), if you are good at modifying CSS animations, then you can make unlimited possibilities of animations to add personalized features to your website!
2016-12-16
comment 0
1336
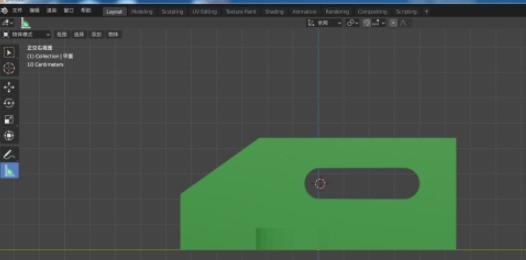
How to get the angle size in blender_Measurement method of angle size in blender
Article Introduction:1. Open the model file whose angle you want to measure in blender, as shown in the picture below. 2. Press the shortcut key ~+6 to switch to the right view, as shown in the picture below. 3. Click the measurement icon, click the left mouse button on the first point, hold it down and drag it to the second point, as shown below. 4. After releasing the mouse, a straight line with a certain length will appear. Click again with the mouse at the red dot below. 5. After clicking, add a point to the original measurement straight line and display an angle dimension, as shown below. 6. Click the middle point with the left mouse button, hold it down, and drag it to the corner, as shown in the picture below. After the two line segments almost coincide with the edge of the part, release the mouse and the angle will be measured: 127 degrees. 7. Press Delete to delete the point, as shown below, leaving only one measurement line. 8. Again
2024-04-07
comment 0
505
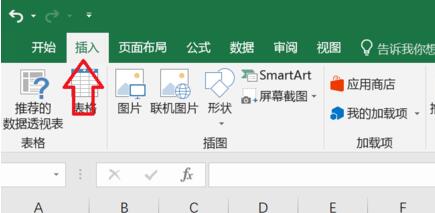
How to put line chart and bar chart together in excel Tutorial on merging line chart and bar chart in excel
Article Introduction:Sometimes when we import data through excel tables, in order to make better comparisons, many users will use line charts and column charts, but they are displayed separately, and the comparison effect is not so obvious, so many small My partner wants to combine these two pictures together. In order to facilitate everyone's operation, this software tutorial will share the specific solutions with the majority of users. Users in need can come to the PHP Chinese website to view the complete operation steps. How to put line chart and column chart together in Excel: 1. First enter the top insertion toolbar. 2. Then select all the data to generate a chart and click the Chart button. (At least 2 types of data are required) 3. After clicking, a data chart will be automatically generated. 4. After generation, right-click the chart and select Update
2024-09-03
comment 0
1196
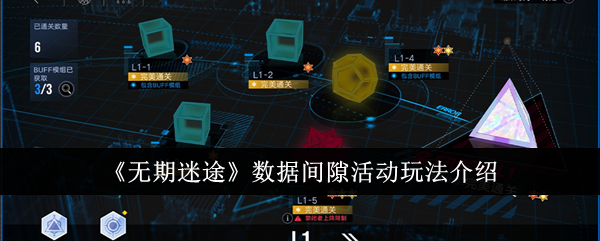
Introduction to how to play the data gap activity in 'Indefinitely Lost'
Article Introduction:How to play the Indefinitely Lost Data Gap event? The game will have a new game content update tomorrow, bringing you a large number of new game activities. The editor has brought you an introduction to the gameplay of the "Infinite Lost Data Gap" event in advance. Interested players must not miss it! "Indefinitely Lost" Data Gap Event Gameplay Introduction Event Time: After the server launch on August 15th ~ 04:59 on August 29th Participation Conditions Unlocking Conditions: Clear Chapter RE1-9 "Reunion on the Other Side" Gameplay Entrance: Main Interface-Activity Hall - Data gap gameplay introduction 01 level challenge After entering the gameplay, the regional level map will be displayed. The director needs to start from the L1 area, challenge and clear some levels, meet the unlocking conditions, and then challenge the regional boss level. After passing the regional boss level, go to
2024-08-15
comment 0
806

What are the characteristics of currency circle fund-raising?
Article Introduction:Fund-raising in the currency circle refers to the behavior of bankers or large investors collecting chips, which usually has the following characteristics: abnormal increase in trading volume; violent price fluctuations; K-line chart shape showing long lower shadow, positive and negative, etc.; main capital inflow; social media dynamics Increased attention; technical analysis indicators show golden crosses, upward trends, etc.; auxiliary judgment factors include news events, project progress, policy changes, etc.
2024-07-16
comment 0
968

Detailed introduction to the process of opening the flash plug-in in Google Chrome
Article Introduction:First we open the chrome Google browser. Then we click the small [three] icon in the upper right corner and select the [Settings] option from the drop-down options. Then we enter the settings interface, drag the page scroll bar to the bottom, find the [Show advanced settings] button and click it. At this time, in the advanced settings options, find the privacy settings and click the [Content Settings] button. The content setting information box pops up, find the plug-in column, and click [Manage various plug-ins]. The last step is to pop up a new window of [Plugins], find the flashplayer plug-in, and check the [Always Allow] button.
2024-05-09
comment 0
528

Efficiency increased by 16 times! VRSO: 3D annotation of purely visual static objects, opening up the data closed loop!
Article Introduction:Annotation of static object detection (SOD), including traffic lights, guide signs and traffic cones, most algorithms are data-driven deep neural networks and require a large amount of training data. Current practice typically involves manual annotation of a large number of training samples on LiDAR-scanned point cloud data to fix long-tail cases. Manual annotation has difficulty capturing the variability and complexity of real scenes and often fails to account for occlusions, different lighting conditions, and diverse viewing angles (yellow arrows in Figure 1). The entire process has long links, is extremely time-consuming, error-prone, and costly (Figure 2). Therefore, companies are currently looking for automatic labeling solutions, especially based on pure vision. After all, not every car has lidar. VRSO+ is a visual-based labeling oriented for static object labeling.
2024-04-11
comment 0
690


