1. Monitoring Summary
To ensure high availability of Linux servers, it is necessary to effectively monitor them and understand the running status of the servers in real time. Whether the performance indicators are normal, to prevent problems before they occur, recording operation and maintenance logs, graphical monitoring, and message alarm mechanisms for problem occurrences are all prerequisites to ensure that the Linux server can provide normal services to the outside world.
Monitoring is an important part of prevention. Let me first talk about what I need to monitor. System load, cpu usage, memory usage, disk space, network traffic, ports, processes, the number of connections to apache or tomcat, and the running status of mysql are all things that need to be monitored. To understand the overall operating status of the server at all times, it is difficult to achieve it by relying solely on a few Linux's built-in performance monitoring commands. Therefore, using shell scripts and open source monitoring tools for server monitoring have become the two main options.
The first thing is to understand some common commands for Linux server monitoring and the monitoring scripts written by these commands. Finally, some mature open source monitoring tools are also necessary.
1) [iostat]: The iostat command is used to display detailed information of the storage subsystem. It is usually used to monitor disk I/O conditions.
2) [meminfo and free]: cat /proc/meminfo free
3) [mpstat]: Real-time system monitoring tool, in a multi-CPUs system, it can not only view the average of all CPUs Status information, and can view specific CPU information
4)[netstat]: Displays a large amount of network-related information
5)[nmon]: Open source tool to monitor Linux systems Performance, download and installation
6) [pmap]: The pmap command is used to report the details of the memory occupied by each process. It can be used to see whether any process has overrun. This command requires the process id as a parameter.
7) [ps pstree]: ps tells you the memory and CPU processing time occupied by each process, and pstree displays the dependencies between processes in a tree structure, including child process information
8) [sar]: sar can be used to display CPU usage, memory page data, network I/O and transmission statistics, process creation activities, and disk device activity details.
9) [strace]: Diagnostic process tools, such as strace ls, but the diagnosed process will slow down
10) [tcpdump] Network monitoring tool, used for basic protocol analysis. See what processes are using the network and how.
11) [uptime]: This command tells you how long this server has been running since it was started.
12) [vmstat] to monitor virtual memory
13) [Wireshark]: It is a network protocol detection program that allows you to capture relevant information about running websites through the program
14) [dstat] Multi-type resource statistics tool: This command integrates vmstat. Three commands, iostat and ifstat
15)[htop]: more friendly top, see the difference between the two: "Comparison between htop and top"
16)[ss]: used Record socket statistics, it can display information similar to netstat, and can also display more TCP and status information
17)[lsof]: list open files
18 ) [iftop] is another top-like program based on network information. It can display the current network connection status sorted by bandwidth usage or upload or download volume
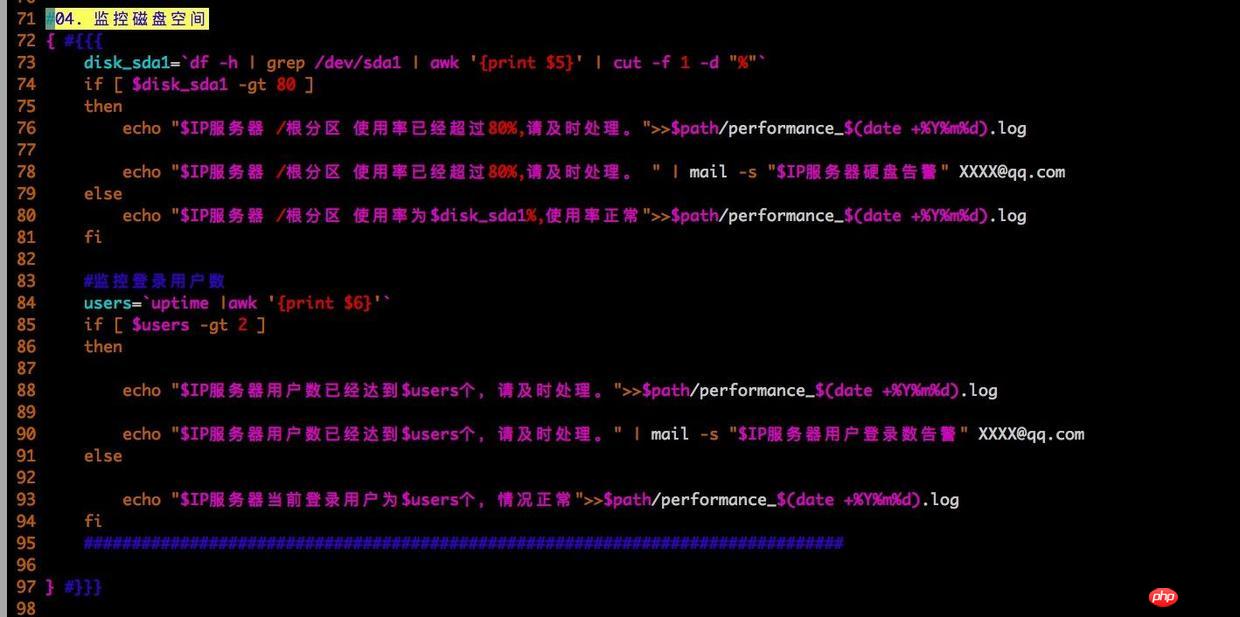
Four scripts are provided here (performance.sh performance monitoring, process.sh process monitoring, network.sh traffic monitoring, tongji.sh traffic analysis and statistics), and use crontab to regularly execute the script to record monitoring data, forming daily monitoring logs and placing them in the following corresponding folders, and exceeding your own settings After receiving the alarm value, an email notification will be sent. For those mailboxes with free SMS notification function, such as Tencent corporate mailbox and 163 mailbox, you can try it. After receiving the email alarm, you will receive the SMS soon, which is very convenient.
Code GitHub address:
The code screenshot is as follows, there are four


Code GitHub Address:
The code screenshot is as follows

Code GitHub address:
Code screenshot is as follows:

Code GitHub address: Code screenshots are as follows:

The above is the detailed content of Detailed explanation of Linux server monitoring examples. For more information, please follow other related articles on the PHP Chinese website!


