


In daily work, Excel sparkline charts can visually display data trends and help us quickly understand the distribution of data. PHP editor Xiaoxin brings you a detailed guide to making Excel mini-charts, explaining step by step how to easily create mini-charts. From inserting sparklines to customizing their appearance, this guide will provide you with concise and clear steps to master the art of creating sparklines. Read on to learn how to use sparklines to effectively analyze and present data.
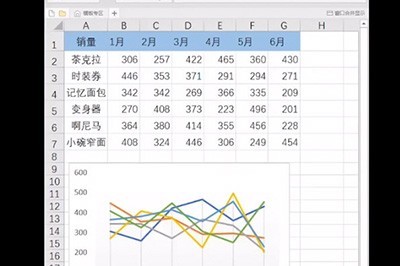
Here is a table as an example. You can see that there is a lot of data. If you add a line chart directly, the chart will be very messy.
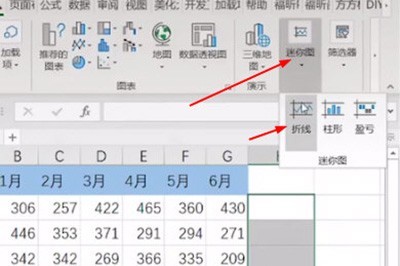
Select the location where you want to add the chart, and click [Insert] - [Sparkline] - [Polyline] above.
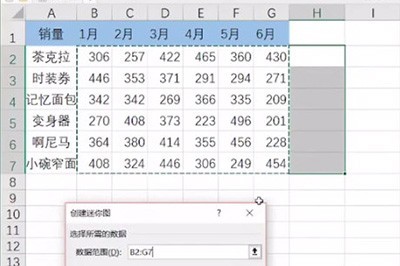
Select the data range when creating a sparkline.
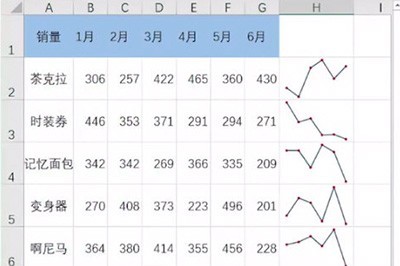
Finally, the mini-graph is added. Then check the [Mark] above and adjust the size of the cells to make the mini-graph more clear.
The above is the detailed content of Steps and methods for making Excel minicharts. For more information, please follow other related articles on the PHP Chinese website!


![[Web front-end] Node.js quick start](https://img.php.cn/upload/course/000/000/067/662b5d34ba7c0227.png)


