
1. Select [Drawing] - [Grid Style] - [Polar Coordinate Grid] menu command, the pole label is [O] and the unit point is [A]. Select the [Ray] tool, hold down the [Shift] key, and draw a horizontal ray labeled CD. Use the [Point] tool to draw any point E on the ray.
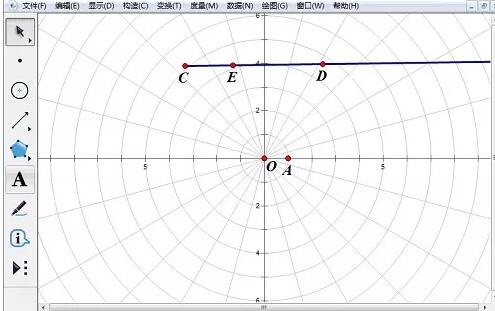
2. Select point C and point E, select [Measure] - [Coordinate Distance] to measure the [Coordinate Distance] of point C and point E. , use the same method to measure the [coordinate distance] between point C and point D. Select the CE and CD measurement values, select [Data] - [Calculation], in the [New Calculation] dialog box, click [CD], [÷], [CE], click the [OK] button, and the calculation results will appear.
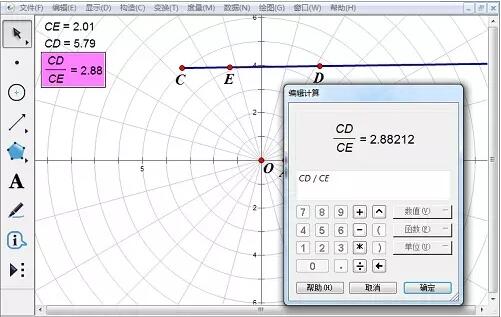
3. Right-click the calculated value, select [Properties] - [Label], change it to [e], select point D, press the shortcut key [Ctrl H], hide the point D.
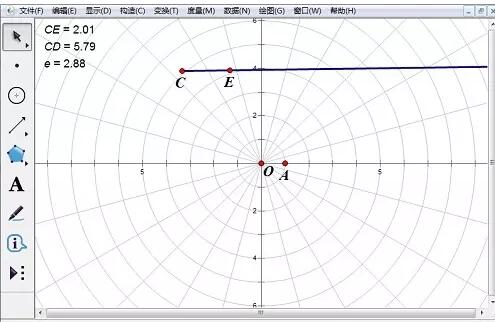
4. Use the same method to construct the horizontal ray FG and the point H on the ray. Use the same method to measure the coordinate distance of points F and H. Change the measurement value label to [p 】, hidden point G.
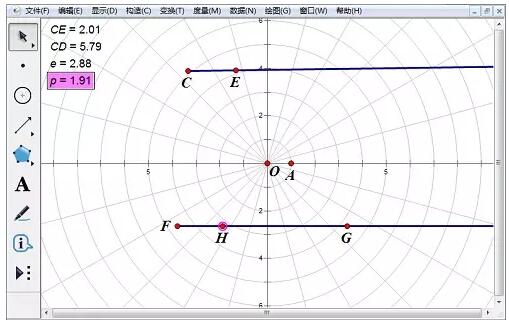
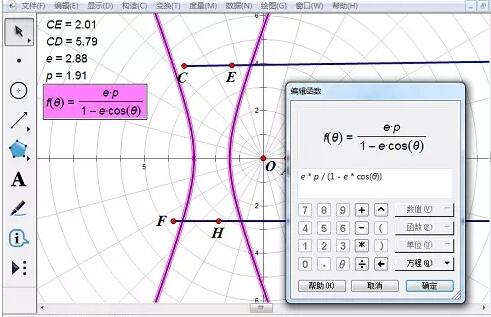
5. Select [e] and [p], click [Draw] - [Draw New Function], in the [New Function] dialog box, click [Equation] button, select [r=f(θ)] in the drop-down list, click and enter [e], [*], [p], [÷], [(], [1], [-], [e] in sequence , [*], [cos], [θ], click the [OK] button, the function image is displayed in the operation area, drag the equation to the appropriate position, and drag the point E or point H to change the curve image
.
The above is the detailed content of Detailed operation method of constructing function image of polar coordinate system in Geometry Sketchpad. For more information, please follow other related articles on the PHP Chinese website!


