
php editor Strawberry will introduce today the detailed method of how to use the CCI indicator to draw stock trend charts in Excel. The CCI indicator is an important technical analysis tool that can help investors determine whether a stock is overbought or oversold and guide investment decisions. Using the CCI indicator to draw stock trend charts in Excel can observe stock price fluctuations more intuitively and provide more reference for investment. Next, we will introduce in detail how to implement this function in Excel, so that investors can easily grasp the stock trend.
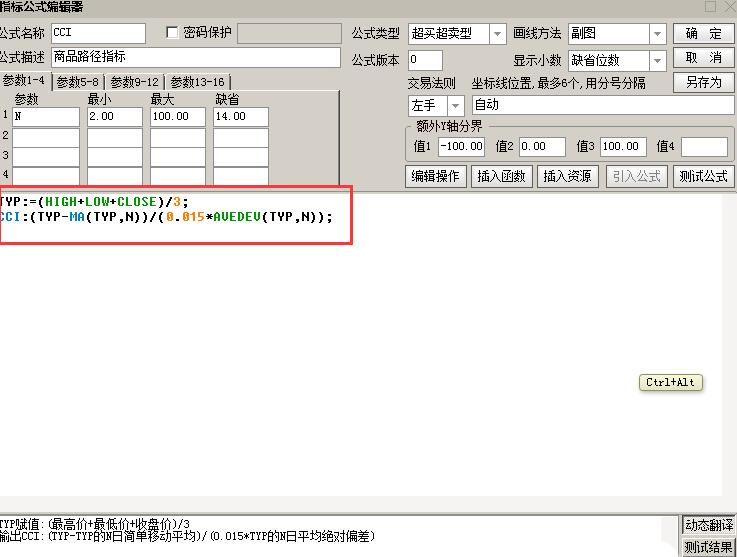
1. From the description of the CCI indicator in the stock software, we can know that the formula of the CCI indicator is
TYP:=(HIGH LOW CLOSE)/3.
CCI:(TYP-MA(TYP,N))/(0.015*AVEDEV(TYP,N)).
The default N is 14 days. Next we will decompose the formula in EXCEL.
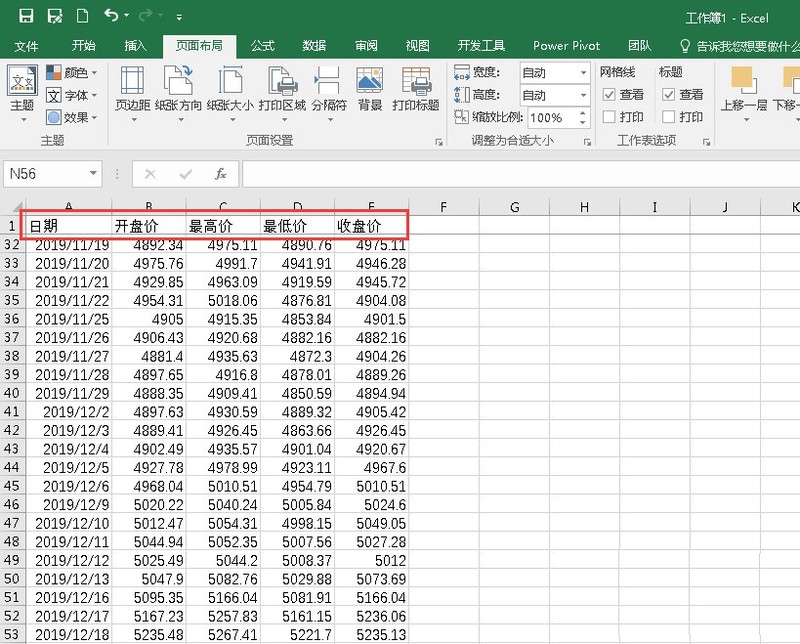
2. Prepare some stock data. In the example, it is the data of an index, which includes date, opening price, highest price, lowest price and closing price.
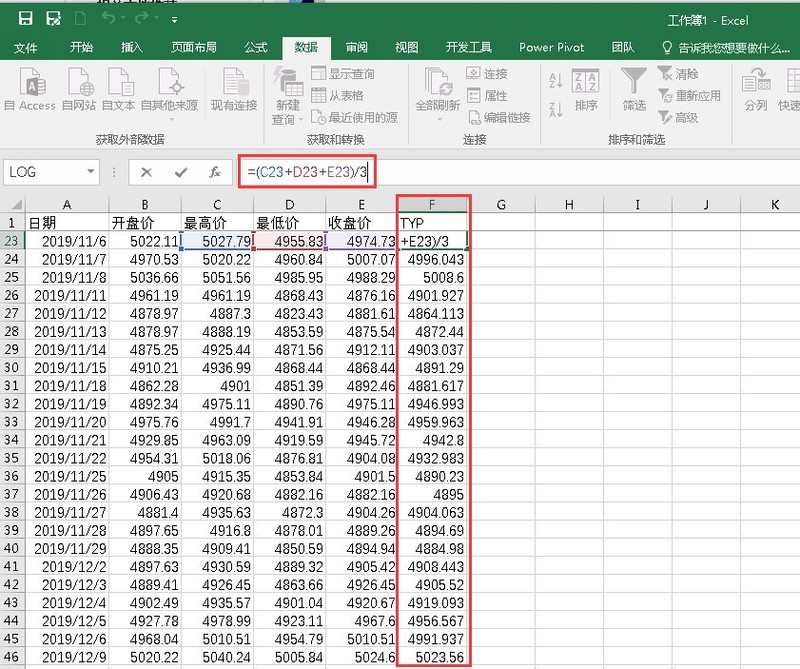
3. Add a column on the right to calculate the parameter TYP. The calculation method is (HIGH LOW CLOSE)/3, that is (highest price lowest price closing price)/3.
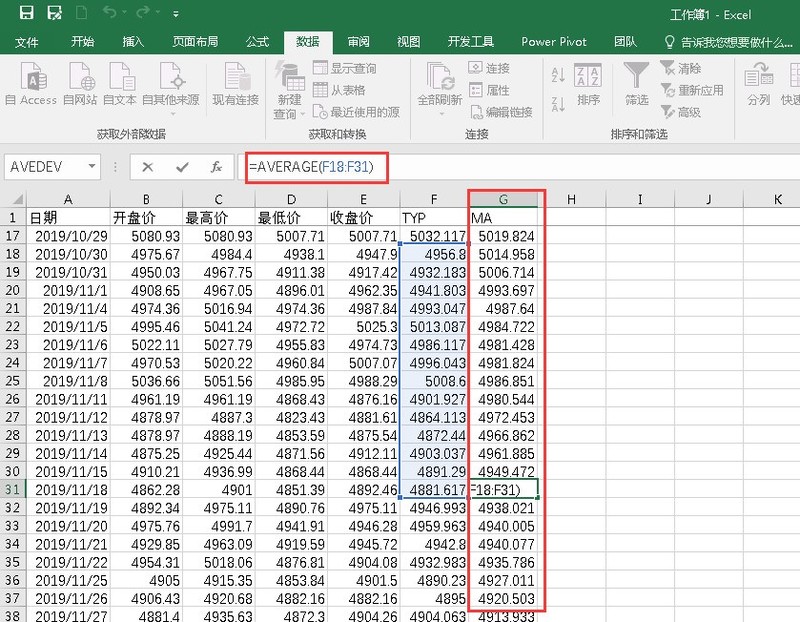
4. Add another column to calculate the parameter MA. The parameter formula is MA(TYP,N), where N is 14, that is, use the AVERAGE function to find the 14-day moving average of the parameter TYP. value.
5. Add a column of calculation parameters AD. The formula is AVEDEV(TYP,N), where N is 14, that is, use the AVEDEV function to find the 14-day average absolute deviation of TYP.
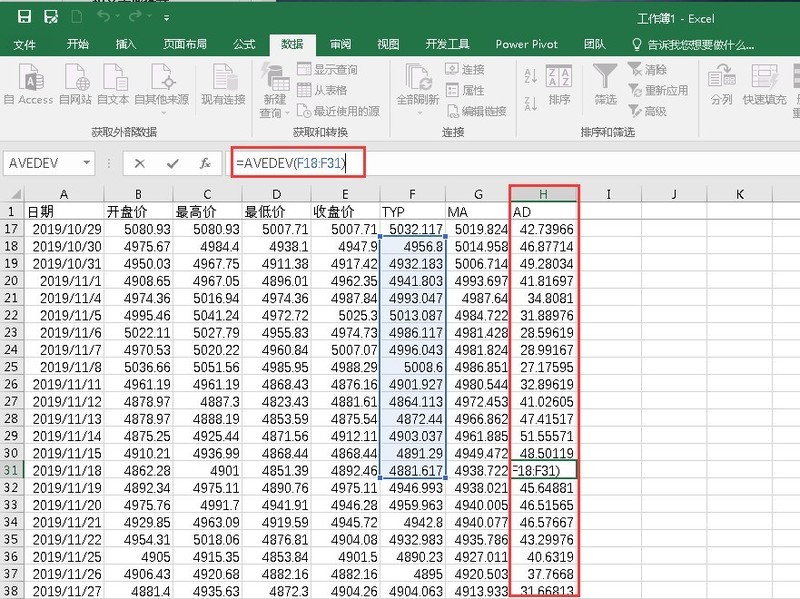
6. Use the formula to calculate (TYP-MA)/(0.015*AD) to get the CCI value. Put the calculated CCI value in the last column and you are done.
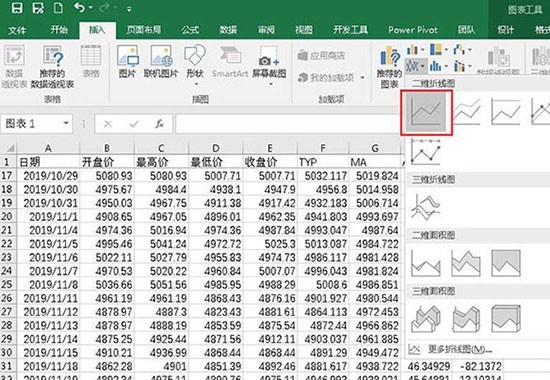
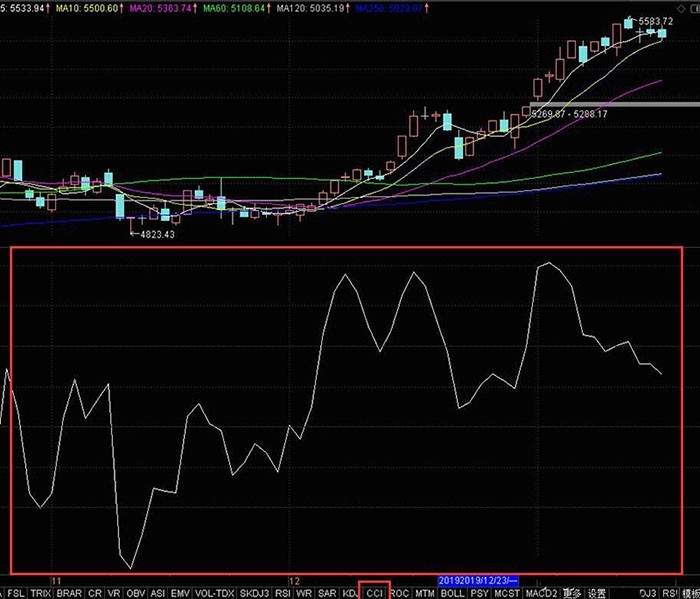
7. In order to intuitively reflect the CCI indicator, you can add a two-dimensional line chart and reference the CCI column as the data source, and use the date as the X-coordinate axis.
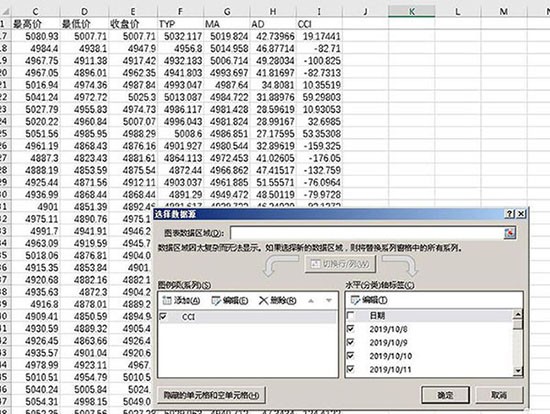
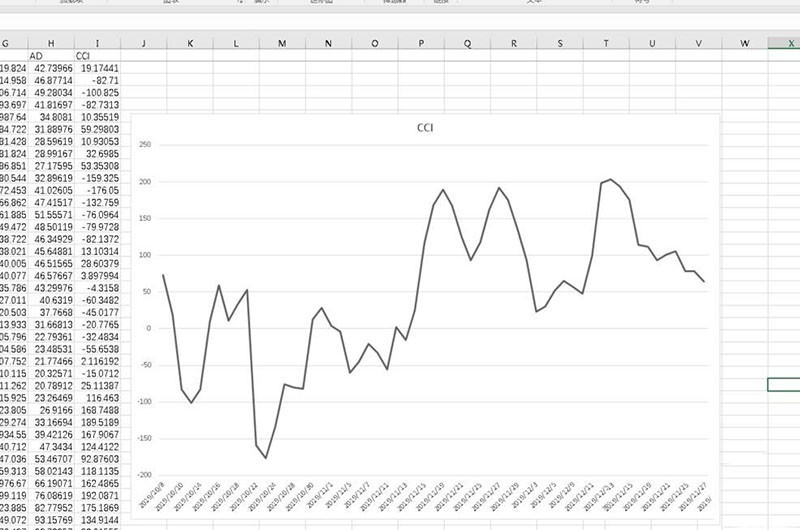
#8. After setting, the line chart of the CCI indicator will appear.
The above is the detailed content of Detailed method of drawing the CCI indicator of stocks in Excel. For more information, please follow other related articles on the PHP Chinese website!


