
php Xiaobian Yuzai today introduces you to a detailed operation of using red and green arrows to display the rise and fall in an Excel table. This technique can make data more intuitive, easier to understand, and improve work efficiency. Following our guidance, you can easily learn this practical data processing method to make Excel tables more readable and practical.
1. Start Excel and execute the ctrl o key combination to open a data list.
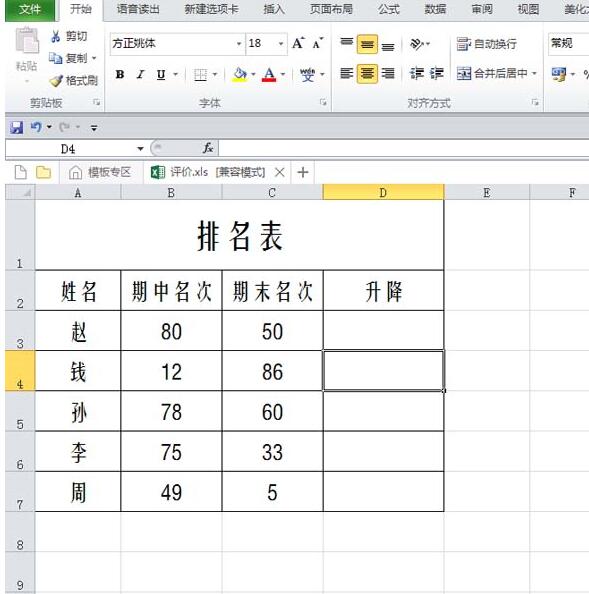
2. Select cell d3, enter the formula =B3-C3 and press Enter to confirm, and then fill in other cells.
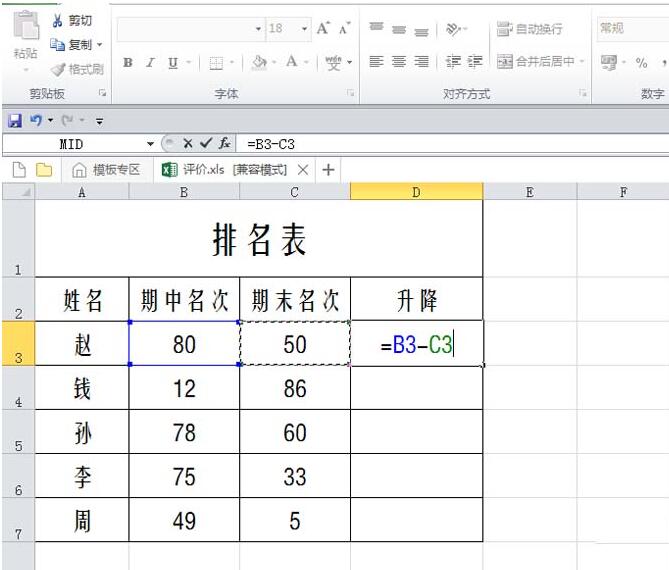
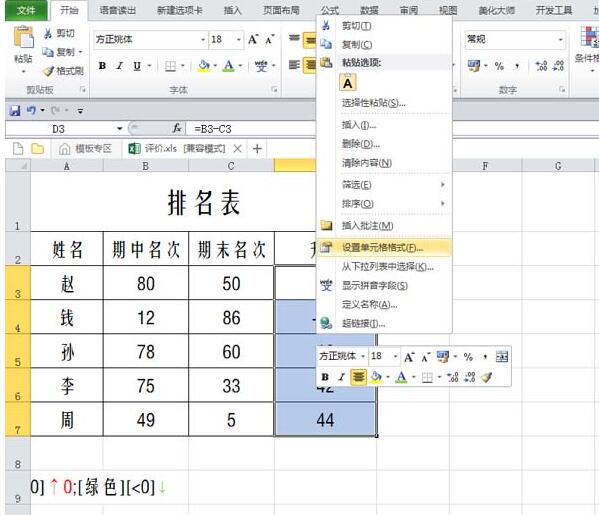
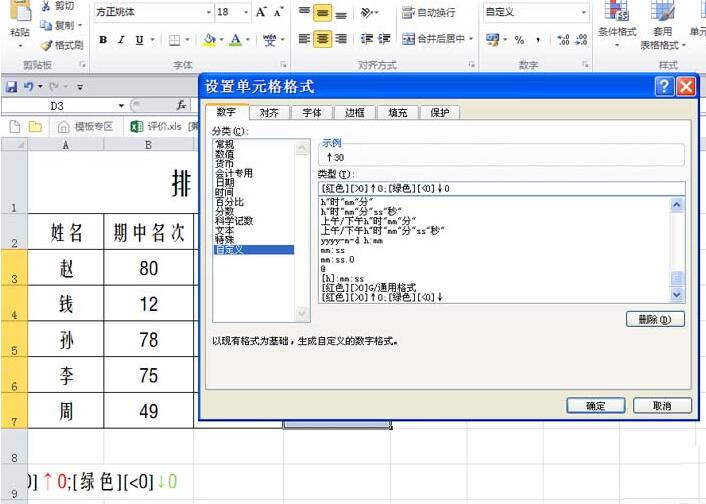
3. Select the data area d3:d7, right-click and select Format Cells.
4. Switch to the Number tab and select the custom option from the category.
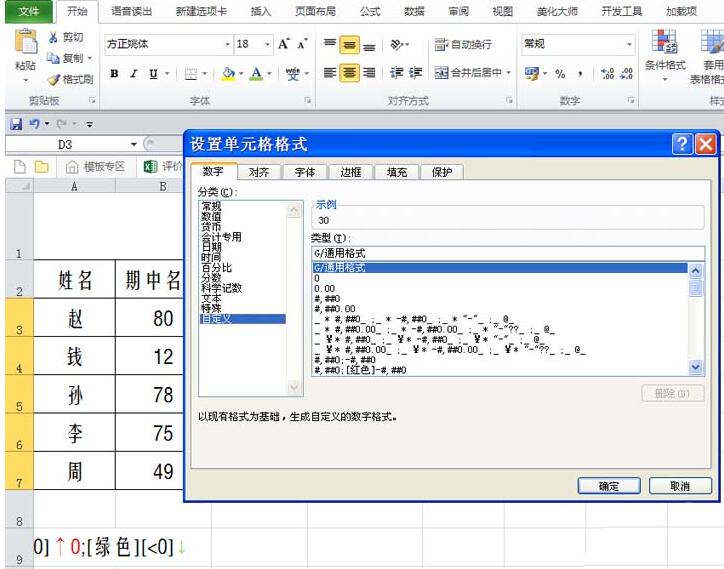
5. Paste the rule you just copied in the type [red][>0]↑0;[green][
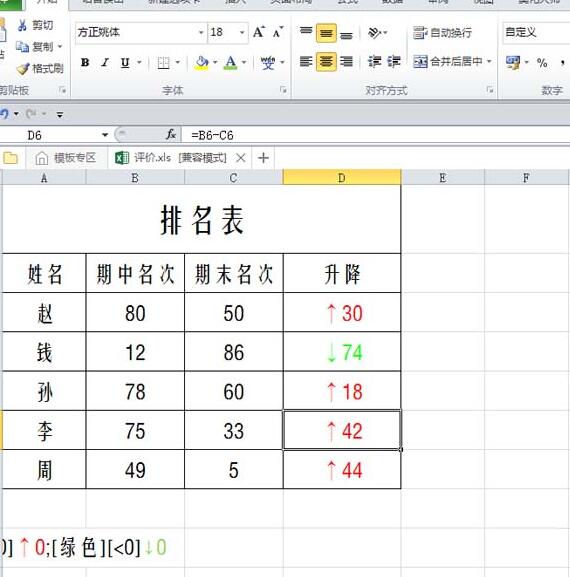
6. Return to the document and view the results. At this time, all the data will be displayed up and down according to the custom rules.
The above is the detailed content of Excel table data uses red and green arrows to indicate detailed operations of lifting and lowering. For more information, please follow other related articles on the PHP Chinese website!
 How to make charts and data analysis charts in PPT
 Android voice playback function implementation method
 AC contactor use
 The difference between vscode and visual studio
 The difference between Java and Java
 Introduction to hard disk interface types
 nagios configuration method
 How to delete a folder in linux


