
No matter how rich the content of the website is, it is meaningless if it is too slow to be accessed; no matter how good the SEO is, it is useless if the search spiders cannot catch it (the relationship between page efficiency and search spiders needs further study) Confirm, this is consistent with the previous article); No matter how user-friendly the website designed by UE is, it is empty talk if users can’t even see it.
So the efficiency of web pages is definitely the most noteworthy aspect. Although we mentioned 14 principles on how to improve the efficiency of web pages in "How to Improve the Efficiency of Web Pages (Part 1) - 14 Principles for Improving Web Page Efficiency", how do we know how efficient our current web pages are? What level is it at? What aspects are not good enough and need improvement? Maybe, you would say, wouldn’t you know it just by asking the users? But compared to user experience, which accounts for too much perceptual proportion, rational tools and data are more convincing. This article will introduce you to a tool for evaluating web page efficiency - YSlow (why slow, this name is so good).
yslow
YSlow is a Firebug-based plug-in released by the Yahoo developer team. Firebug is a plug-in based on FireFox. So YSlow is a plug-in based on FireFox plug-in. Although it is a bit convoluted, the final problem explained is:
Unfortunately, YSlow cannot be used in Microsoft's IE series browsers.
YSlow can only be used on FireFox browser.
If you want to use YSlow, you must install FireFox first.
If you want to use YSlow, then you need to install the Firebug plug-in on FireFox.
This may seem a bit frustrating, but in fact it is not as troublesome as you think. Just follow the steps below and you will be able to use YSlow quickly:
Go to //m.sbmmt.com/ to download the latest version of FireFox and install it. Of course, you can skip this step if you have already installed FireFox.
Go to //m.sbmmt.com/ to download the latest version of Firebug and install it. Of course, you can skip this step if you have already installed Firebug.
Go to //m.sbmmt.com/ to download the latest version of YSlow and install it. Of course, you can skip this step if you have already installed YSlow.
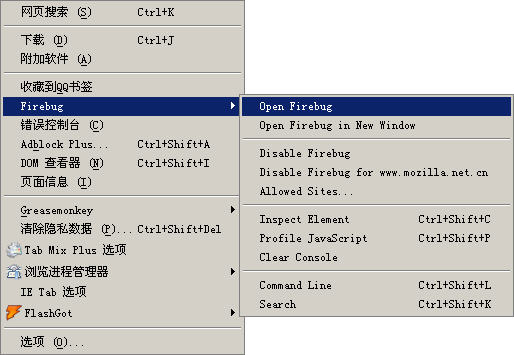
Figure 2: Open the Firebug plug-in in the menu first
Now open FireFox, you will be in the [Tools] menu See [firebug] in (Figure 2). Open firebug, and then click the YSlow menu in firebug to enter the main interface of YSlow (Figure 3).
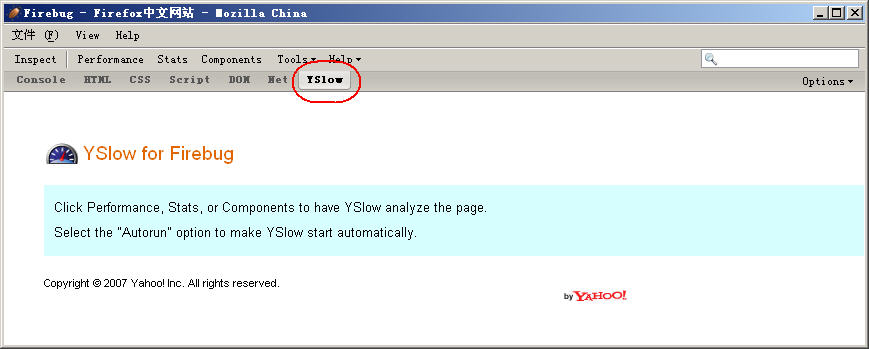
Figure 3: First open the Firebug plug-in in the menu (click on the small image to view the full image)
YSlow will start to analyze the efficiency of this page and give an evaluation from the 13 aspects that most affect the efficiency of the web page. (As shown in Figure 4).
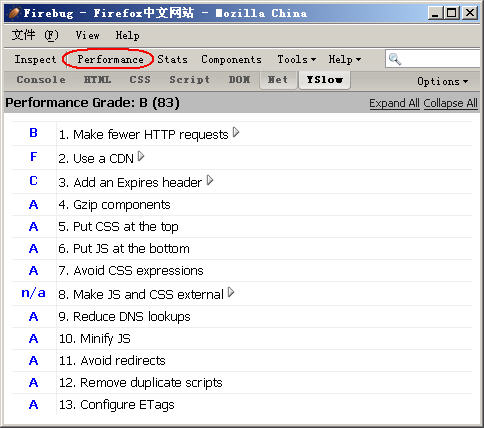
Figure 4: Efficiency evaluation of this page given by YSlow
It can be seen that the basis for YSlow's evaluation is our "How to Improve the Efficiency of Web Pages (Part 1) - 14 Guidelines for Improving Web Page Efficiency" The 13 mentioned above. The blue letters in front indicate the score for this criterion. A is the highest. Click the triangle on the right to get more information and suggestions. Some information also has a "magnifying glass" icon. Clicking it will also display more detailed information and suggestions. (As shown in Figure 5)

Figure 5: YSlow can give detailed evaluation information and suggestions for each criterion
This view will tell you the overall statistics of the page. Including page size, css style sheet size, script file size, overall image size, flash file size and image file size used in css. It will also tell you what things are cached, how much is cached, etc.
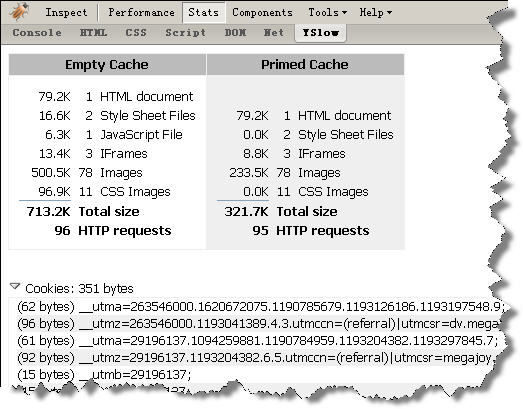
Figure 6: [Stats] view information
This view is an information list of all components of the page. From this we can learn various details about each component. Such as: type, URL, Expires data, status, size, reading time, ETag information, etc. By analyzing this list, we can know what consumes our resources the most, so we can optimize it in a targeted manner.
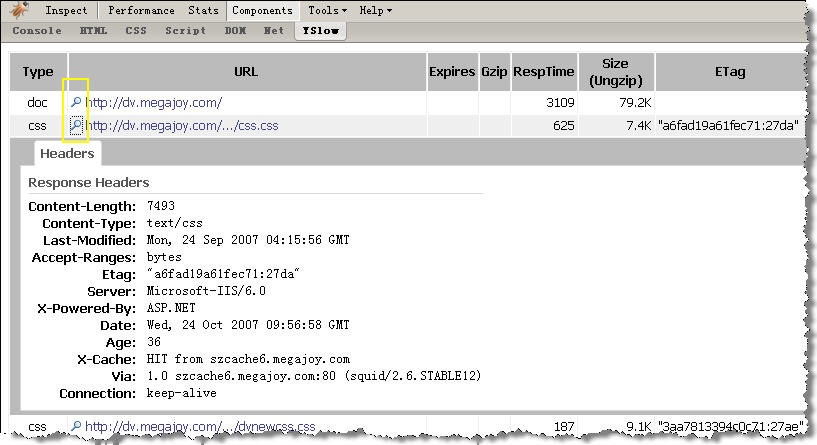
Figure 7: [Components] view information, click on the "magnifying glass" icon to know more detailed information (click on the small image to view the complete large image)
The [Tools] menu contains 4 submenus, which are 4 practical tools. The [JSLine] tool will generate a JSLine report. The report is an analysis report of the JS scripts in this web page, including errors and suggestions. [ALL JS] tool will generate a report page with all the script codes on this page that is easy to read and print. The [ALL CSS] tool will generate a report page with all CSS style sheet codes on this page that is easy to read and print. [Printable View] generates a report page more suitable for reading and printing from the information in the [Performance] and [Stats] views.

Figure 8: [Tools] menu, including 4 submenus
[Help] is mainly the entrance to some commonly used help methods. From here you can easily access YSlow's official website and blog. If you still have any questions about the use of YSlow, you will get satisfactory answers here.
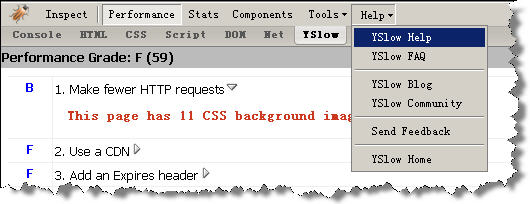
Figure 8: [Help] menu is some common help entrances
“If a worker wants to do his job well, he must first sharpen his tools!” Good tools can indeed greatly improve our work efficiency. But even if "Adou" holds the "Fangtian Painted Halberd" in his hand, it is estimated that not many people are afraid of him. Good tools are one thing, but what is more important is improving our own knowledge level. Just like this YSlow, if you don’t have the theoretical knowledge in "How to Improve the Efficiency of Web Pages (Part 1) - 14 Guidelines for Improving Web Page Efficiency", the tool provides The information we see may only be superficial. Even if we understand the data, it is difficult for us to know the corresponding means and measures. A strong man should hold a strong axe, so that he can cut wood quickly and easily.


