


This paper in AAAI 2024 was jointly published by the Singapore Agency for Science, Technology and Research (A*STAR) and Nanyang Technological University, Singapore. It proposed a method of using graph-aware contrastive learning to improve multivariate time series classification. Experimental results show that this method has achieved remarkable results in improving the performance of time series classification.
 Picture
Paper title: Graph-Aware Contrasting for Multivariate Time-Series Classification
Download address: https://arxiv. org/pdf/2309.05202.pdf
Open source code: https://github.com/Frank-Wang-oss/TS-GAC
Author Based on existing contrastive learning methods, a method called graph-aware contrast (TS-GAC) is proposed, which aims to solve the spatial consistency problem of multi-sensors in MTS data. TS-GAC consists of two main components: graph enhancement and graph comparison. Graph enhancement improves spatial consistency through node and edge enhancement to maintain sensor stability and relevance. The graph comparison introduces multi-window time comparison to maintain time consistency. Through extensive experimental verification, this method achieves optimal performance on various MTS classification tasks. The findings highlight the importance of considering spatial consistency in contrastive learning of MTS data and provide a comprehensive solution that significantly improves classification performance. This research is of great significance for further improving the effect of contrastive learning and provides a powerful tool for processing MTS data.
 Picture
The method proposed in this article mainly includes two parts: graph enhancement and graph comparison.
In order to effectively enhance MTS data, we introduce node and edge enhancement to generate weak views and strong views. Node enhancement includes frequency domain and time domain enhancement to fully enhance graph nodes. First, we apply frequency domain enhancement to enhance the nodes, and then segment the enhanced samples into multiple windows according to the dynamic local patterns in the MTS data (as shown in Figure 2). In each window, we use node temporal augmentation and perform feature extraction on the window through a one-dimensional convolutional neural network. Subsequently, we construct a graph for each window and further enhance the graph through edge enhancement. Finally, we use a graph neural network-based encoder for graph processing and feature learning.
 Picture
Graph comparison: including node-level comparison and graph-level comparison to achieve spatial consistency. Node-level comparison ensures the robustness of node features by pulling corresponding sensors closer in different views and pushing different sensors farther away in different views. Graph-level comparison further ensures the robustness of global features by comparing samples in different views.
The goal of this architecture is to achieve spatial consistency in contrastive learning, and specific enhancement and contrast techniques are provided for MTS classification. By first applying node enhancement, then utilizing temporal enhancement within nodes, and finally edge enhancement processed by GNN, this method is able to generate weak and strong views with different spatial and temporal properties for each sample. The innovation of this method is that it not only considers temporal consistency, but also enhances spatial consistency through graph structure, providing a new perspective for in-depth analysis and processing of MTS data.
In view of the characteristics of MTS data, that is, as data collected by multiple sensors, the author proposes two main methods of node and edge enhancement:
Node enhancement: divided into frequency domain enhancement and time domain enhancement. Frequency domain enhancement converts the signal of each sensor to the frequency domain, enhances the extracted frequency features, and then converts the enhanced frequency features back to the time domain to obtain an enhanced signal. Specifically, the discrete wavelet transform is used to decompose the signal through high-pass and low-pass filters to represent macro-trends and micro-trends within the signal. Time domain enhancement takes into account the dynamic characteristics of MTS data by dividing each MTS sample into multiple windows and performing time domain enhancement in each window.
Edge enhancement: aims to enhance the correlation between sensors, that is, the edges in the constructed graph. The nodes (sensors) and edges (correlations between sensors) are first defined through a graph building process. Then, the correlation between sensors is effectively enhanced through the edge enhancement method. In this step, considering that strong correlation is more important than weak correlation in the feature propagation of GNN, when performing edge enhancement, the strongest s correlations are retained to ensure the stability of topological information, and The remaining correlations are replaced with random values to enhance the edge connections.
Through these enhancement strategies, the author aims to generate weak views and strong views so that the subsequent contrastive learning process can learn robust sensor features and inter-sensor relationships. The design of these enhancement strategies takes into account the multi-source and dynamic nature of MTS data, and enhances the capabilities of CL by providing data views from different angles, so that more robust and generalized representations can be learned.
The paper proposes a graph-aware comparison method, which specially designs node and edge enhancement and graph comparison strategies to enhance the spatial consistency of MTS data. It mainly includes three levels of comparison: multi-window time comparison, node-level comparison, and graph-level comparison.
Multi-Window Temporal Contrasting (MWTC): This method ensures the temporal consistency of each sensor at the sensor level and maintains the robustness of temporal dependence within MTS data through predictive coding. sex. MWTC maintains the robustness of temporal patterns by summarizing past window information in one view and comparing it to future windows in another view.
Node-level Contrasting (NC): NC learns robust sensor-level features by comparing sensors in different views within each MTS sample. This involves maximizing the similarity between corresponding sensors in two views while minimizing the similarity between different sensors in those views.
Graph-level Contrasting (GC): GC promotes robust global-level feature learning by comparing samples within each training batch. This strategy works by maximizing the similarity between corresponding samples in two views while minimizing the similarity between different samples in those views.
These contrastive learning strategies work together to enhance representation learning of MTS data through graph structures, thereby improving classification accuracy. The article also highlights the importance of temporal comparison to maintain temporal consistency for each sensor, as well as the role of graph comparison in learning robust features at the sensor and global levels. By combining node-level and graph-level comparisons, this method can effectively learn complex spatial and temporal patterns in MTS data and achieve significant improvement in MTS classification performance.
In the experimental part, the paper compares the performance on ten public multivariate time series data sets and compares it with the existing state-of-the-art methods. . These datasets include Human Activity Recognition (HAR), ISRUC sleep stage classification, and sub-datasets in the UEA dataset such as finger movements, spoken Arabic numerals, etc. For fair comparison, all methods use the same encoder. Experimental results show that TS-GAC achieved the best performance on eight of the data sets, especially on the HAR and ISRUC data sets. Compared with other methods, the accuracy increased by 1.44% and 3.13% respectively.
 Picture
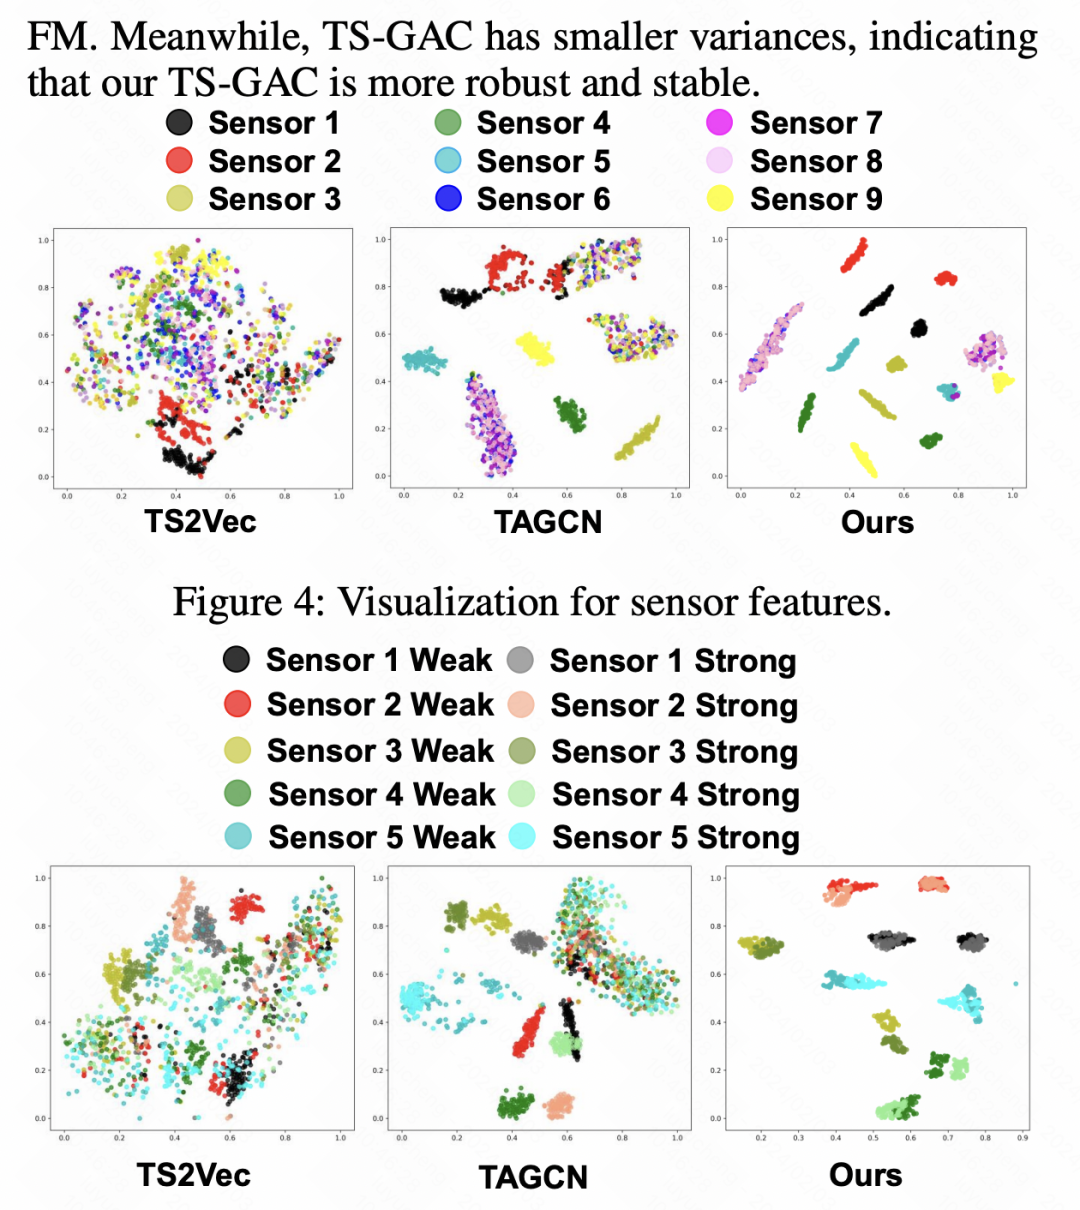
At the same time, the author also visualized the model features. The visualization results enabled TS-GAC to extract more discernible sensor-level features. . At the same time, compared with other methods, TS-GAC can obtain more consistent sensor-level features for data from different viewing angles.
 Picture
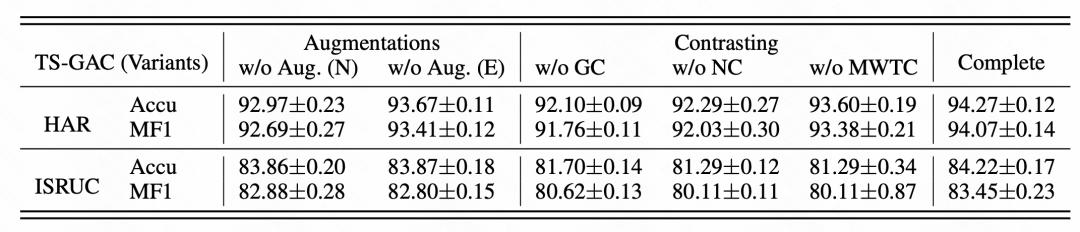
The authors also conducted ablation studies to evaluate the impact of the designed enhancement and contrast techniques on model performance. The ablation study tested different variants, including those that removed node enhancement, removed edge enhancement, removed graph-level contrast, removed node-level contrast, and removed multi-window temporal contrast. The results show that graph enhancement and graph contrast techniques are extremely effective in improving the spatial consistency of MTS data, and the full TS-GAC shows better performance than any variant that reduces contrast loss.
 Picture
In addition, the author also analyzed the sensitivity of the model, including the impact and retention of hyperparameters (such as λMWTC, λGC, λNC) Effect of number of edges. These analyzes further confirm the effectiveness and robustness of the proposed method.
Overall, the experimental results highlight the ability of TS-GAC to achieve optimal performance on multiple MTS classification tasks, proving that the proposed graph enhancement and graph comparison techniques improve the spatial consistency of the model on MTS data. Importance and validity of sexual aspects.
The above is the detailed content of Graph-aware contrastive learning improves multivariate time series classification effects. For more information, please follow other related articles on the PHP Chinese website!
 attributeusage
 Website domain name valuation tool
 What are the cloud servers?
 How to solve the problem of missing steam_api.dll
 Ethereum browser query digital currency
 The main components that make up the CPU
 What are the java file transfer methods?
 How to set the computer to automatically connect to WiFi
 Is Bitcoin trading allowed in China?


![[Web front-end] Node.js quick start](https://img.php.cn/upload/course/000/000/067/662b5d34ba7c0227.png)


