


##This issue uses python’s pyecharts visualization library PlotBeijing’s historical weather datato seehistorical high temperature and historical low temperature distribution, as well as wind power and wind direction distribution during the day and night,Hope it is helpful to everyone. If you have any questions or areas that need improvement, please contact the editor.
Involved libraries:
Pandas— Data processing
Pyecharts— Data visualization
import pandas as pd from pyecharts.charts import Line from pyecharts.charts import Bar from pyecharts.charts import Scatter from pyecharts.charts import Pie from pyecharts.charts import EffectScatter from pyecharts.charts import Calendar from pyecharts.charts import Polar from pyecharts import options as opts import warnings warnings.filterwarnings('ignore')
df_weather = pd.read_excel('./2018-2022年天气数据.xlsx')
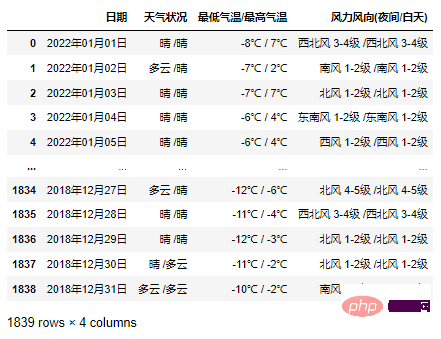
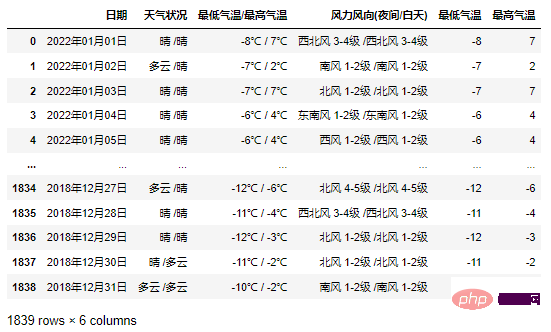
df_weather_1 = df_weather.copy() df_weather_1[['最低气温','最高气温']] = df_weather_1['最低气温/最高气温'].str.split(' / ',expand=True) df_weather_1['最低气温'] = df_weather_1['最低气温'].str[:-2] df_weather_1['最高气温'] = df_weather_1['最高气温'].str[:-1] df_weather_1['最低气温'] = df_weather_1['最低气温'].astype('int') df_weather_1['最高气温'] = df_weather_1['最高气温'].astype('int')
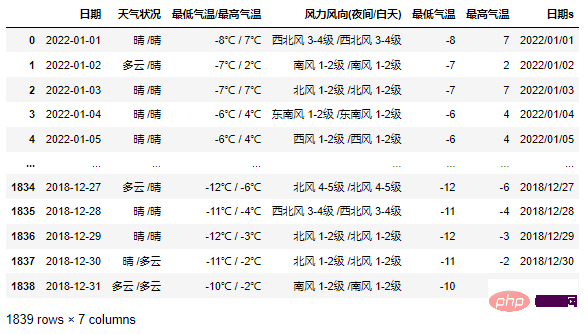
2.3 处理日期数据
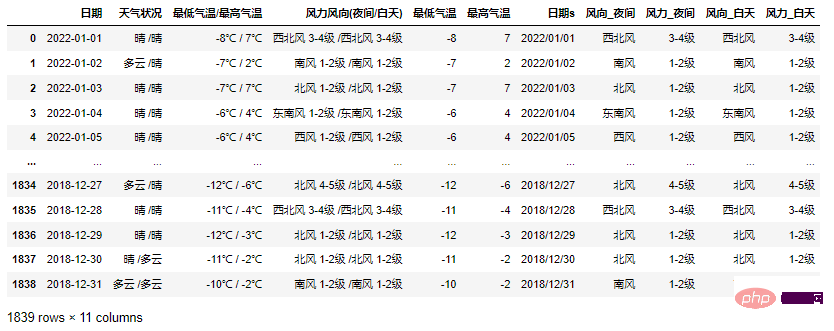
df_weather_1['日期'] = pd.to_datetime(df_weather_1['日期'],format='%Y年%m月%d日') df_weather_1['日期s'] = df_weather_1['日期'].dt.strftime('%Y/%m/%d')
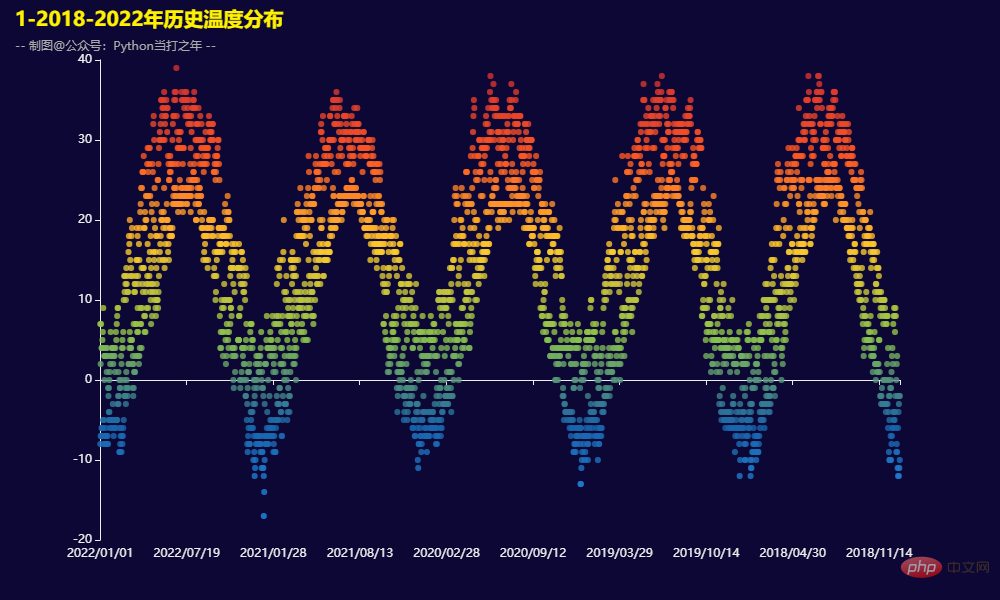
def get_scatter(): scatter = ( Scatter() .add_xaxis(x_data) .add_yaxis("最低气温", y_data1) .add_yaxis("最高气温", y_data2) .set_global_opts( legend_opts=opts.LegendOpts(is_show=False), visualmap_opts=opts.VisualMapOpts( is_show=False, range_color=range_color ), title_opts=opts.TitleOpts( title='1-2018-2022年历史温度分布', subtitle='-- 制图@公众号:Python当打之年 --', pos_top='1%', pos_left="1%", ) ) )
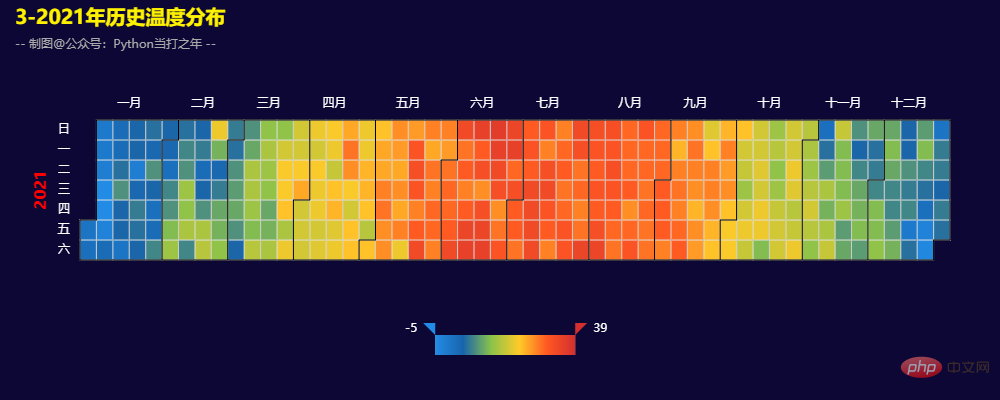
def get_calendar(): calendar = ( Calendar() .add('', data_21, calendar_opts=opts.CalendarOpts( pos_right='5%', range_='2021', daylabel_opts=opts.CalendarDayLabelOpts(name_map='cn'), monthlabel_opts=opts.CalendarMonthLabelOpts(name_map='cn') ), ) .set_global_opts( title_opts=opts.TitleOpts( title='3-2021年历史温度分布', subtitle='-- 制图@公众号:Python当打之年 --', pos_top='1%', pos_left="1%", ), visualmap_opts=opts.VisualMapOpts( range_color=range_color, ) ) )

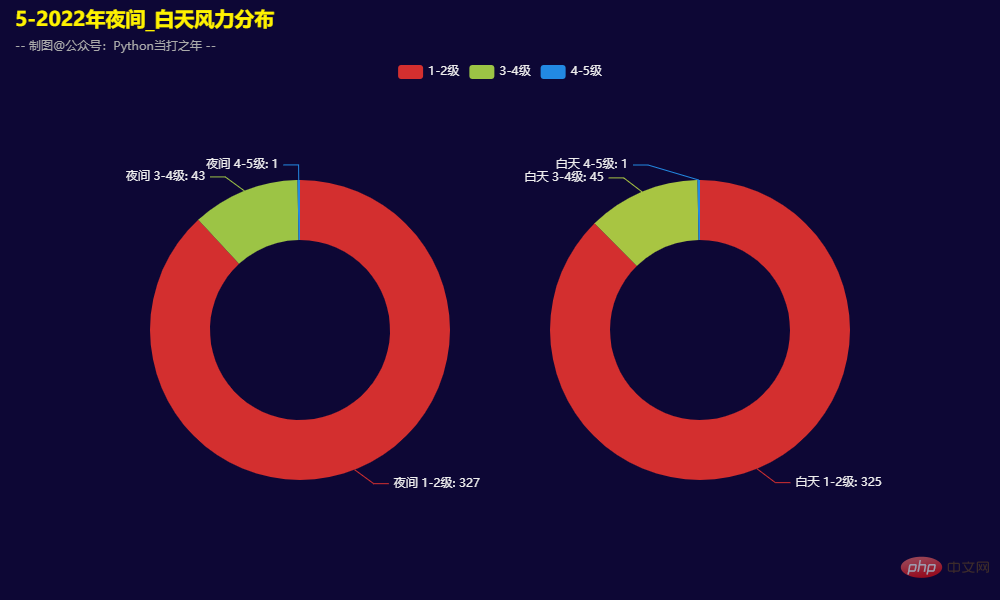
3.5 2022年夜间_白天风力分布
def get_pie(): pie = ( Pie() .add( "", [list(z) for z in zip(x_data, y_data1)], radius=["30%", "50%"], center=["30%", "55%"], ) .add( "", [list(z) for z in zip(x_data, y_data2)], radius=["30%", "50%"], center=["70%", "55%"], ) .set_global_opts( title_opts=opts.TitleOpts( title='5-2022年夜间_白天风力分布', subtitle='-- 制图@公众号:Python当打之年 --', pos_top='1%', pos_left="1%", ), legend_opts=opts.LegendOpts(pos_top='10%'), visualmap_opts=opts.VisualMapOpts( is_show=False, range_color=range_color ), ) )
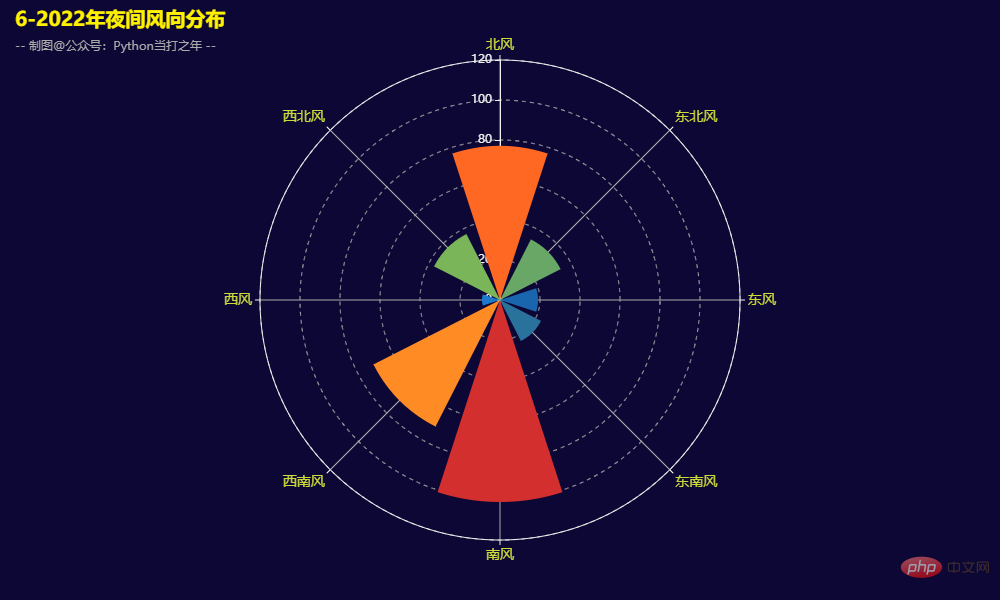
def get_polor(): polor = ( Polar() .add("", values,type_="bar") .set_global_opts( legend_opts=opts.LegendOpts(is_show=False), visualmap_opts=opts.VisualMapOpts( is_show=False, range_color=range_color ), title_opts=opts.TitleOpts( title='6-2022年夜间风向分布', subtitle='-- 制图@公众号:Python当打之年 --', pos_top='1%', pos_left="1%", ), ) )
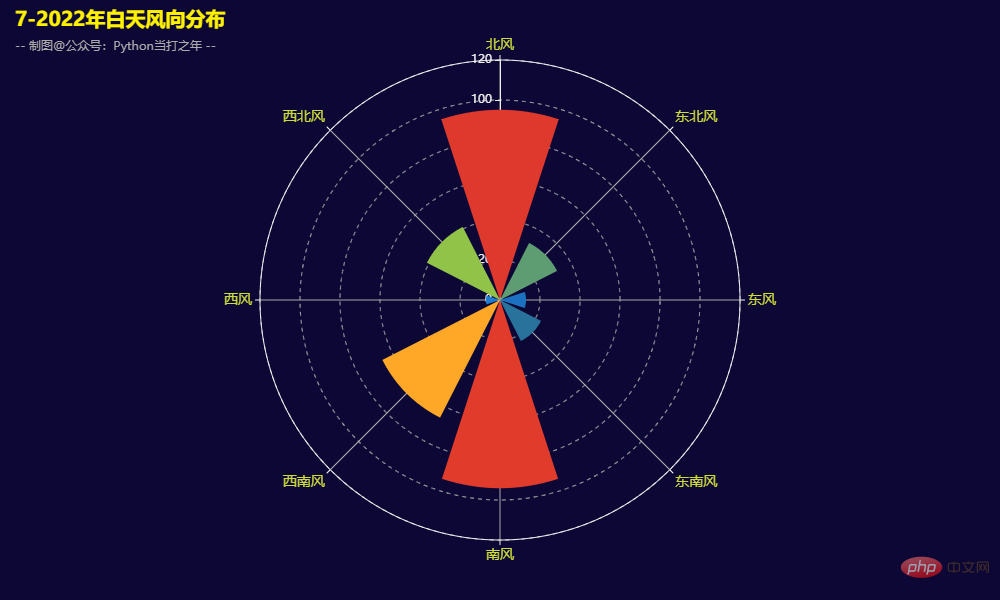
3.7 2022年白天风向分布
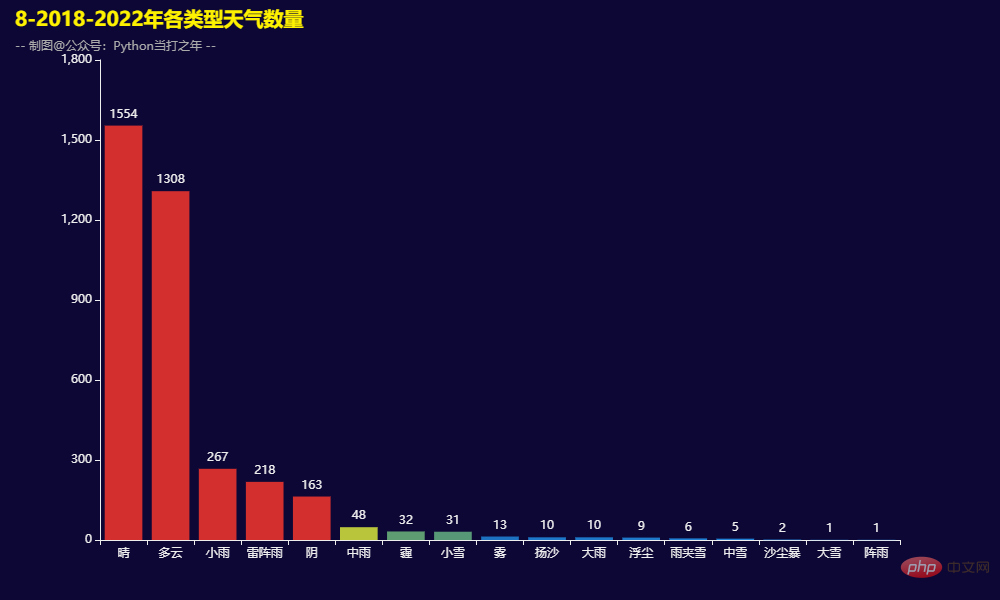
3.8 2018-2022年各类型天气数量
def get_bar(): bar = ( Bar() .add_xaxis(x_data) .add_yaxis("",y_data) .set_global_opts( visualmap_opts=opts.VisualMapOpts( is_show=False, range_color=range_color ), legend_opts=opts.LegendOpts(is_show=False), title_opts=opts.TitleOpts( title='8-2018-2022年各类型天气数量', subtitle='-- 制图@公众号:Python当打之年 --', pos_top='1%', pos_left="1%", ), ) )
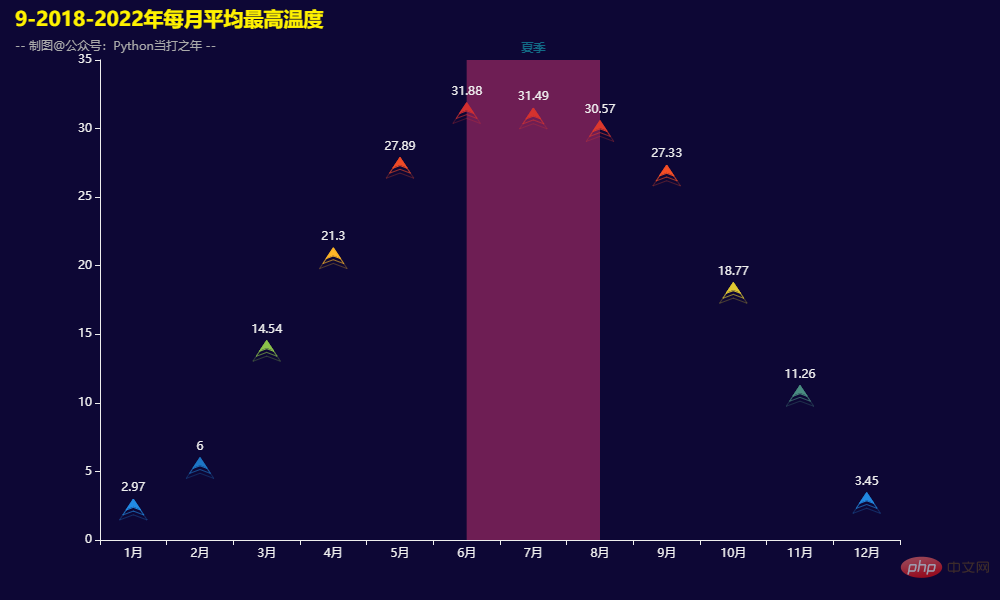
3.9 2018-2022年每月平均最高温度
The above is the detailed content of Pandas+Pyecharts | Visualization of historical weather data in Beijing in the past five years. For more information, please follow other related articles on the PHP Chinese website!


![[Web front-end] Node.js quick start](https://img.php.cn/upload/course/000/000/067/662b5d34ba7c0227.png)


