
Recently I am learning Linux webserver development and need to debug my own C/C code under Linux. However, Linux is not as convenient as directly Visio Studio or other integrated development environments under Windows. , it is quite troublesome to develop under Linux now. So you can consider usingVScodefor remote development. However, many tutorials on the Internet are not very clear. After trying many tutorials, I encountered many pitfalls. The final summary is as follows. [Recommended learning: "vscode tutorial"]
Remote system: ubuntu18.04 (virtual machine)
Development host: windows10
(1) Install necessary software: ssh (system communication), gdb, gsdbserver (code debugging):
sudo apt-get install openssh-server sudo apt-get install gdb sudo apt-get install gdbserver
(2) Create test folders and files
Note:
cd ~/桌面 mkdir testvs cd testvs touch main.cpp gedit main.cpp
The main.cpp code is:
#includeint main() { int a = 1; printf("hello world\n"); getchar(); return 0; }
(3 ) Compile and get the executable file
##g main.cpp -o main -gNote:
(4) Start gdbserver
(4.1) First look at your ubuntu system ip address:
hostname -I You can get the local ip address as
192.168.199.131
(4.2) Start gdbserver (note changing the ip address and test file directory)
gdbserver 192.168.199.131:2000 ~/Desktop/testvs/main
(1) First install the following plug-ins in VScode:
C/C(2) ssh remote connectionLower left corner "Management"->"Control Panel", then find the option "Remote-SSH: Connect to Host..." -> Add New SSH Host...
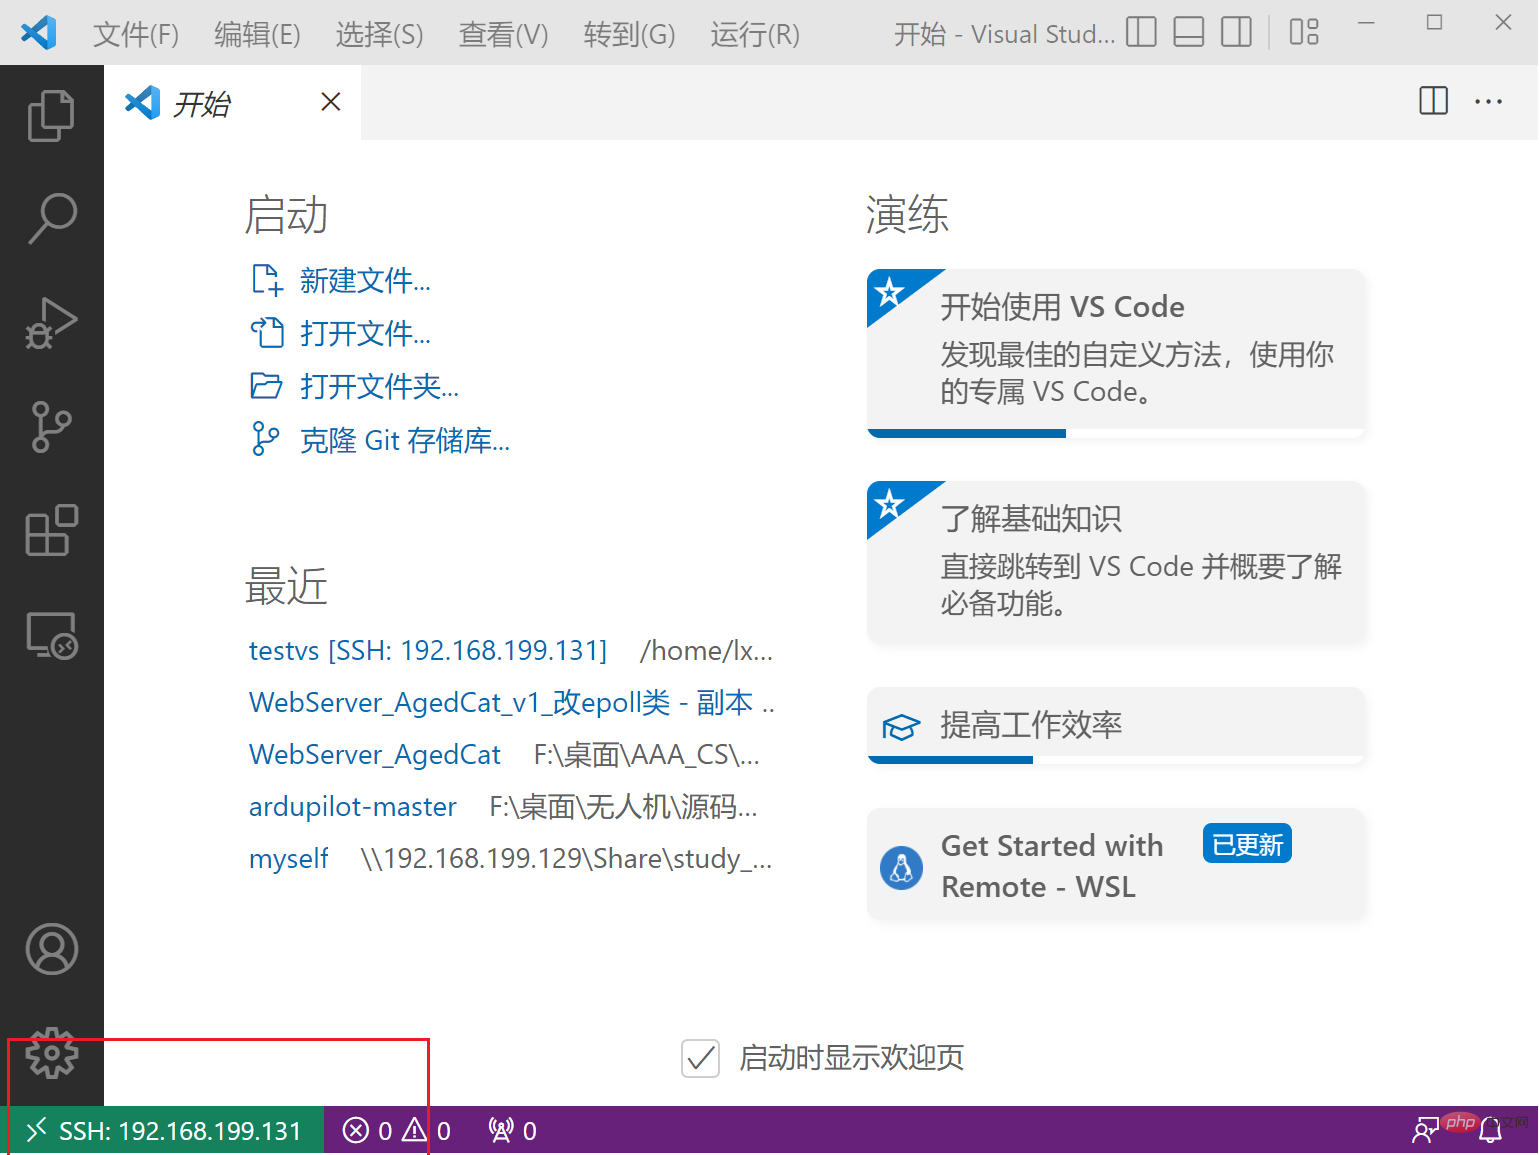
Enter the ubuntu system IP address, and a new interface will appearEnter the ubuntu system password in the red box. If the green IP address is displayed in the lower left corner, the connection is successful, as shown below.

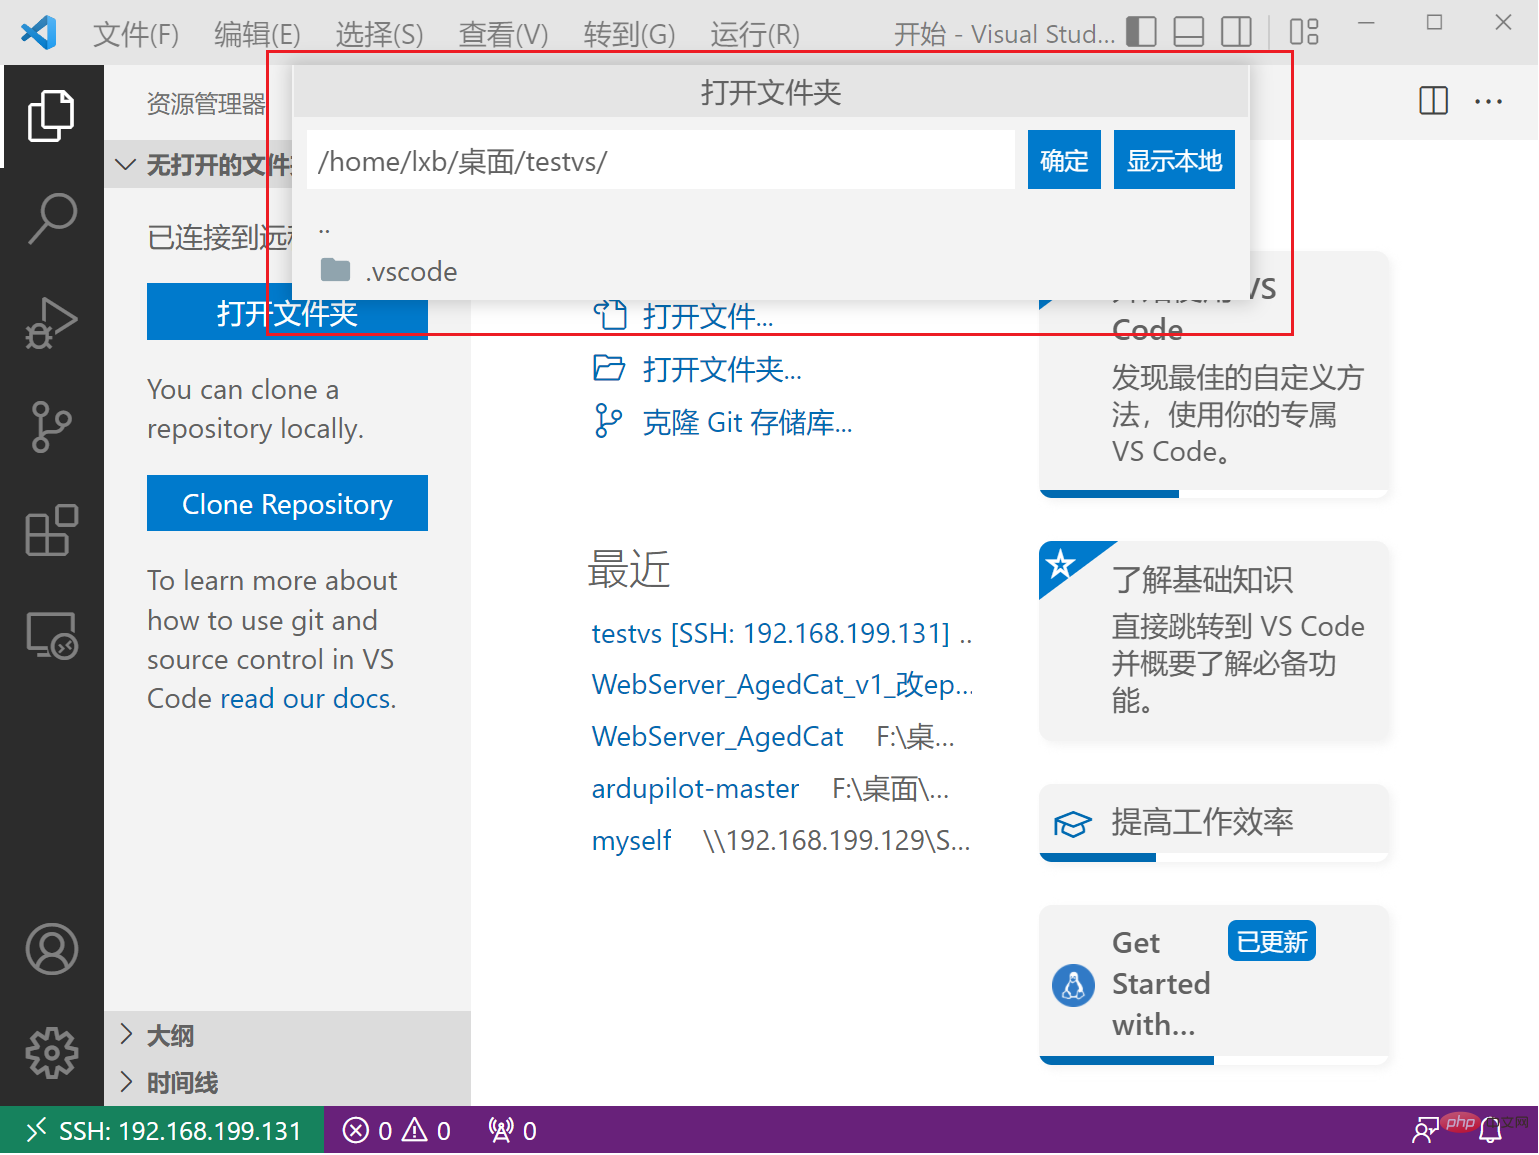
(3) Open the test fileOpen the folder-> Select the test folder directory , click the "OK" button
Select the C/C extension and "Install in SSH:XXX". The same applies to C/C Extension Pack Then restart Vscode and gdbserver in Ubuntu (it must be restarted, otherwise an error will be reported in the next steps) and re-execute the above remote connection process.
(4) Set the configuration file
(4.1) Configure tasks.jsonFrom Select Terminal>Configure Default Build Task in the menu bar, and select C/C in the drop-down bar: g build active file. Then generate the tasks.json file and replace the content with:
{ // 有关 tasks.json 格式的文档,请参见 // https://go.microsoft.com/fwlink/?LinkId=733558 "version": "2.0.0", "tasks": [ { "type": "shell", "label": "g++ build active file", "command": "/usr/bin/g++", "args": [ "-std=c++11", "-g", "${file}", "-o", "${fileDirname}/${fileBasenameNoExtension}" ], "options": { "cwd": "/usr/bin" }, "problemMatcher": [ "$gcc" ], "group": { "kind": "build", "isDefault": true } }, { //删除二进制文件 "type": "shell", "label": "delete output file", "command": "rm", "args": [ "${fileDirname}/${fileBasenameNoExtension}" ], "presentation": { "reveal": "silent", //删除过程不切换终端(专注程序输出) } } ] }
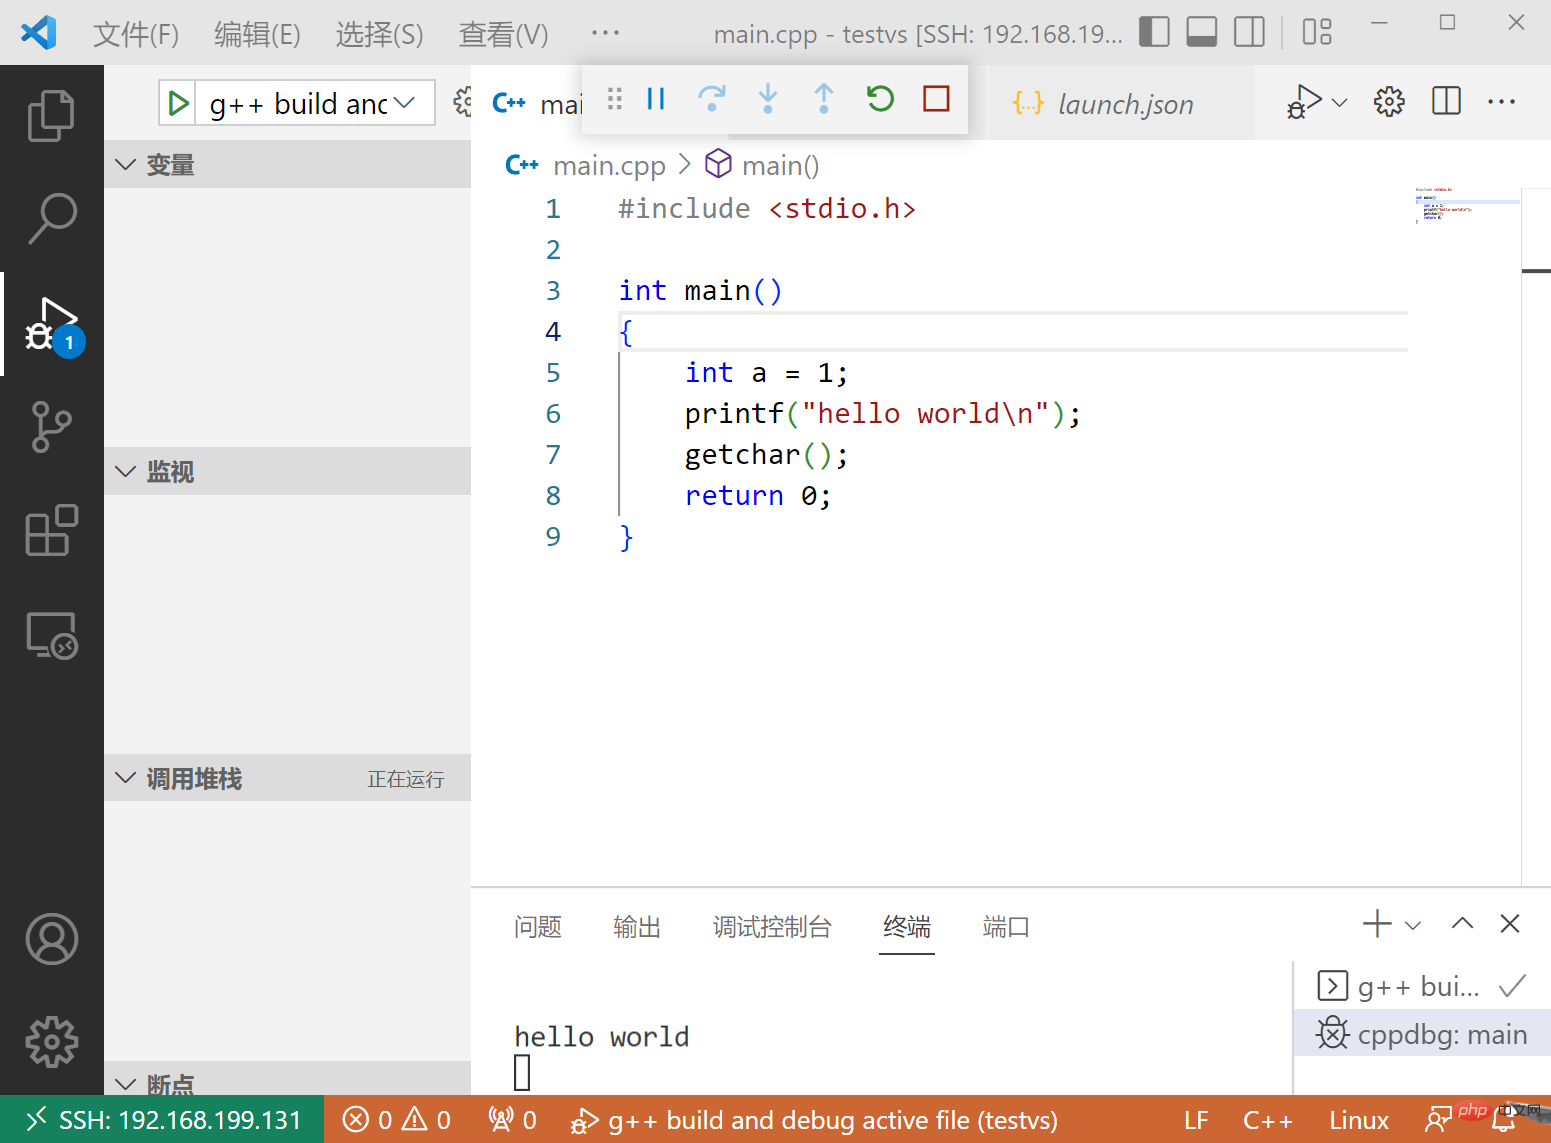
Select Debug>Add Configuration in the menu bar, select C (GDB/LLDB), select g build and debug active file in the drop-down bar. Generate launch.json, and change the content to:
{ // 使用 IntelliSense 了解相关属性。 // 悬停以查看现有属性的描述。 // 欲了解更多信息,请访问: https://go.microsoft.com/fwlink/?linkid=830387 "version": "0.2.0", "configurations": [ { "name": "g++ build and debug active file", "type": "cppdbg", "request": "launch", "program": "${fileDirname}/${fileBasenameNoExtension}", "args": [], "stopAtEntry": false, "cwd": "${workspaceFolder}", "environment": [], "externalConsole": false, "MIMode": "gdb", "setupCommands": [ { "description": "为 gdb 启用整齐打印", "text": "-enable-pretty-printing", "ignoreFailures": true } ], "preLaunchTask": "g++ build active file", "postDebugTask": "delete output file", "miDebuggerPath": "/usr/bin/gdb" } ] }
 More about For VSCode related knowledge, please visit:
The above is the detailed content of Detailed configuration explanation: remote debugging c++ in vscode. For more information, please follow other related articles on the PHP Chinese website!