
This article brings you relevant knowledge about javascript, which mainly introduces JavaScript debugging skills, including Sources panel, setting breakpoints and other related issues. I hope it will be helpful to everyone. .
Related recommendations: javascript video tutorial
As a front-end development, we will often use console.log() to Debugging problems in the program. Although this method can also solve some problems, it is not as efficient as a tool that can perform step-by-step debugging. This article will learn how to use Google Chrome developer tools to easily debug JavaScript code.
Most browsers provide DevTools for us to debug JavaScript applications, and they are used in similar ways. As long as we learn how to use debugging tools on one browser, it is easy to use them on other browsers. Use it on the device.
The following takes the Greet Me program as an example. This program is very simple. You only need to enter your name and wish, and finally a sentence will be output:
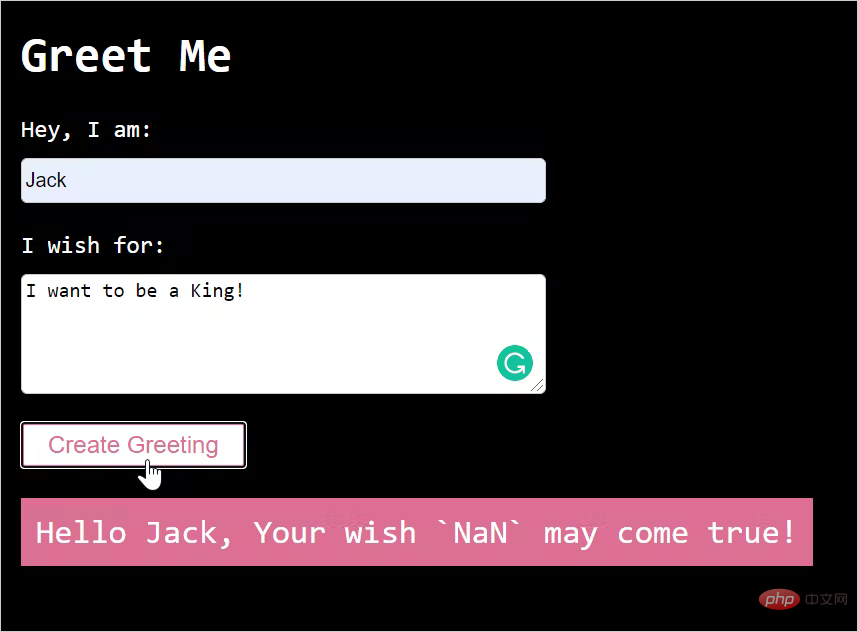
When input After two form values, the "wish" part is not printing correctly, instead it prints out NaN. Code online debugging: https://greet-me-debugging.vercel.app/. Next, let’s take a look at what features Chrome DevTools has to debug positioning code problems.
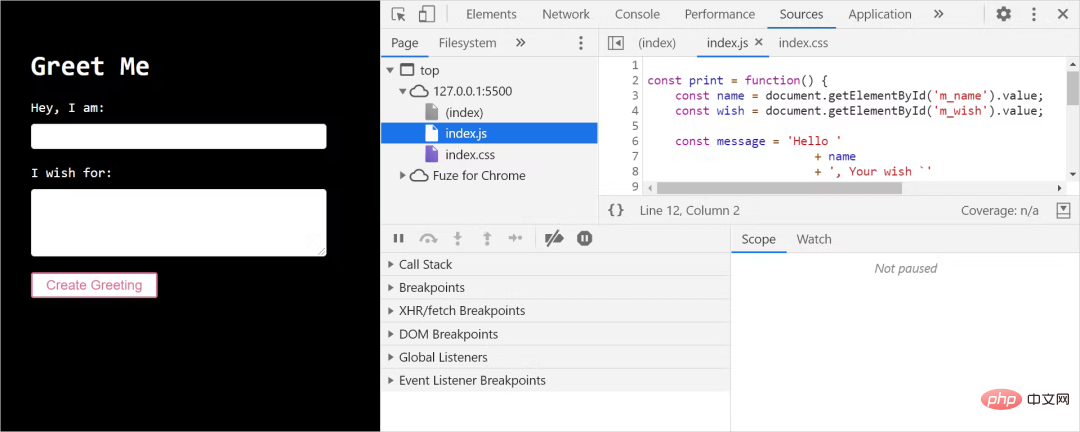
DevTools provides many different tools for us to debug, including DOM inspection, analysis, and network call inspection. What I want to talk about here is the Sources panel, which can help us debug JavaScript. You can open Control Panel using the shortcut F12 and click the Sources tab to navigate to the Sources panel, or you can open it directly using the shortcut Command Option I (Mac) or Control Shift I (Windows, Linux).
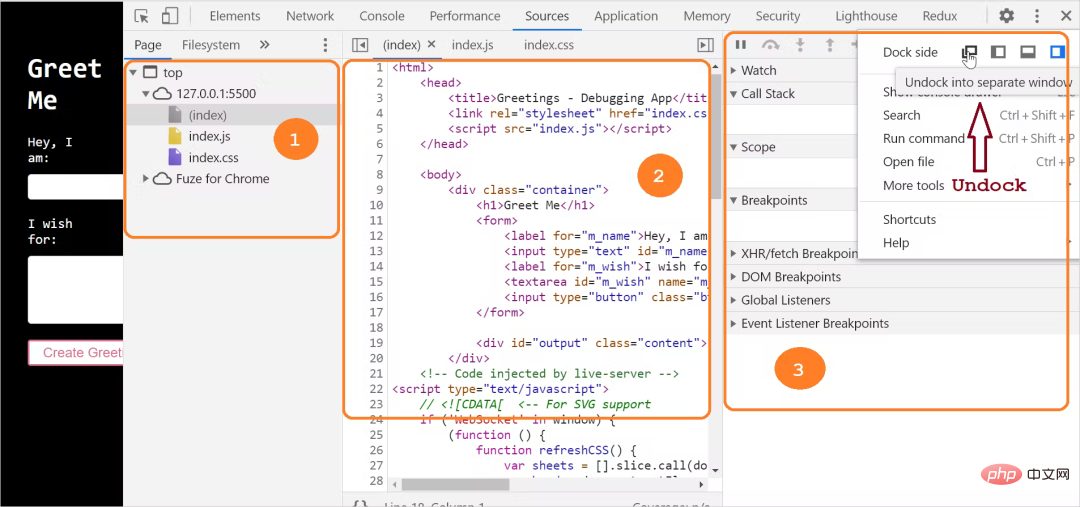
The Sources panel is mainly composed of three parts:
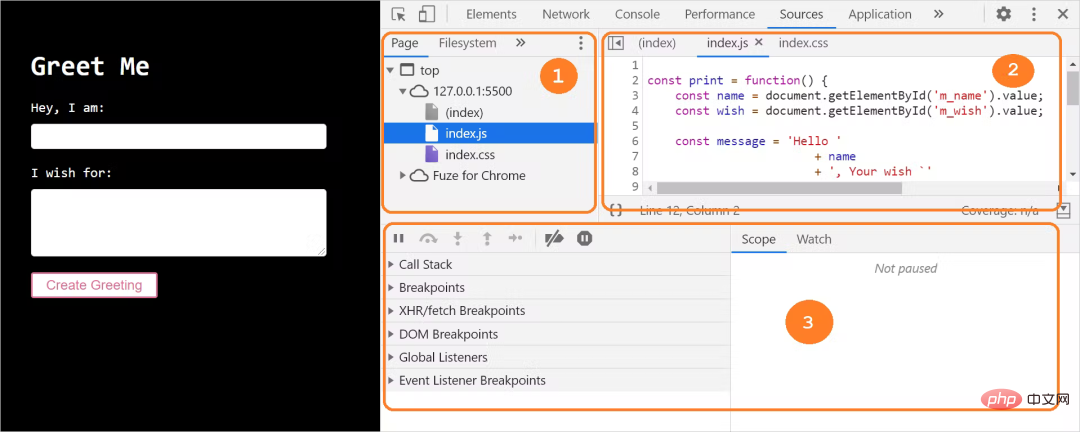
File Navigation Area: Page All requested files will be listed here;
Code editing area: When we select a file from the file navigation bar, the contents of the file will be listed here. You can edit the code here;
Debugger area: There are many tools here that can be used to set breakpoints, check variable values, observe execution steps, etc.
If the DevTools window is wider or not opened in a separate window, the debugger section will appear on the right side of the code editor:
To start debugging the code, the first thing to do is to set a breakpoint. A breakpoint is a logical point where code execution is paused in order to debug it.
DevTools allows us to set breakpoints in different ways:
at the line of code;
in the conditional statement ;
At the DOM node;
On the event listener.
Steps to set a breakpoint on a line of code:
Click to switch to Sources tab;
Select the source file that needs to be debugged from the file navigation section;
Find the source file that needs to be debugged in the code editor area on the right Line of Code;
Click the line number to set a breakpoint on the line.
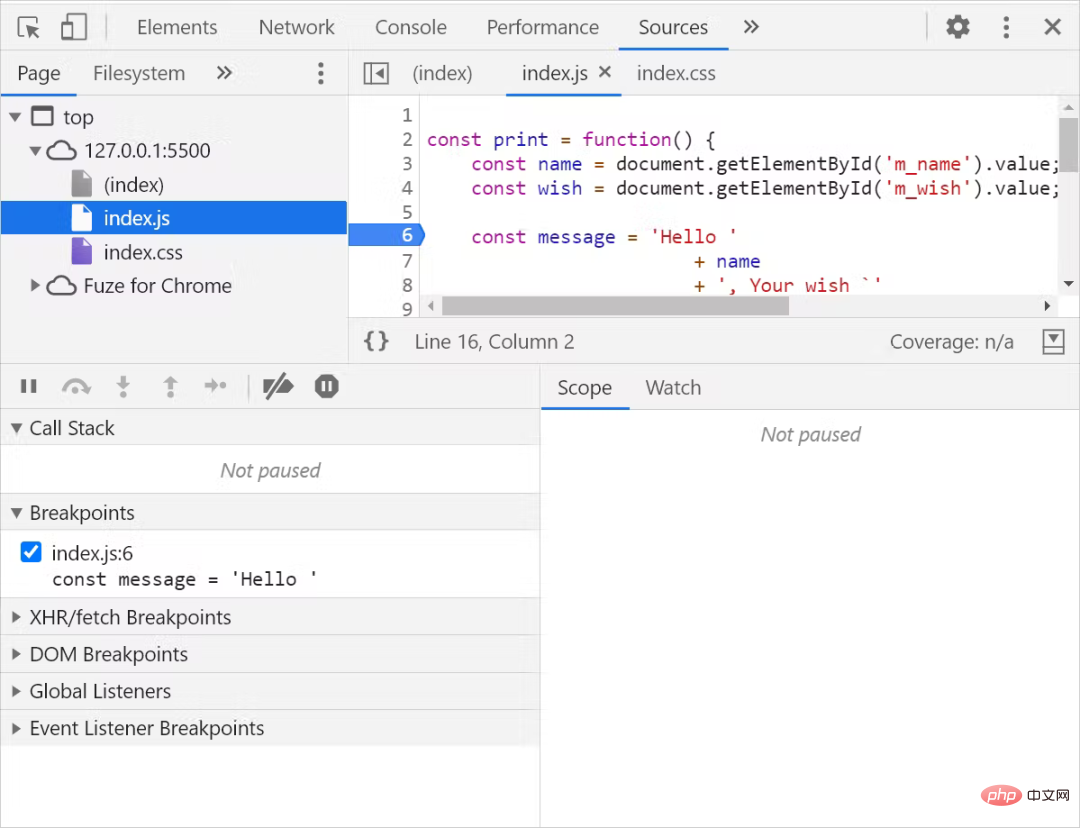
A breakpoint is set at line 6 of the code, and the code will pause when it is executed here.
Steps to set conditional breakpoints:
Click to switch to the Sources tab;
Select the source file that needs to be debugged from the file navigation section;
Find the line of code that needs to be debugged in the code editor area on the right;
Right-click the line number and select "Add conditional breakpoint" to add a conditional breakpoint:

Click below the line of code A dialog box will appear. Just enter the conditions for the breakpoint:
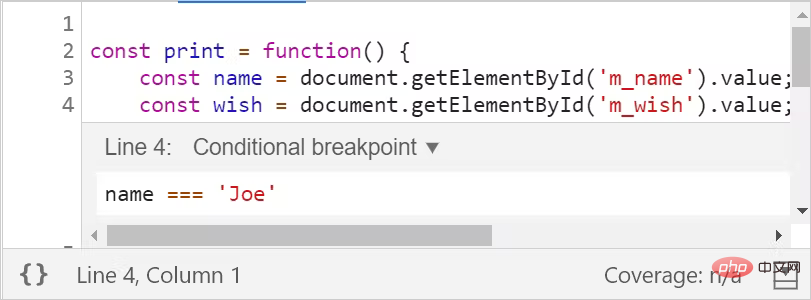
Press the Enter key (Enter) to activate the breakpoint, and then the breakpoint will be interrupted. An orange icon appears at the top of the dot row:

When the name variable value in the print() method is Joe, the execution of the code will be suspended. It should be noted that conditional breakpoints will only be used when we are sure of the approximate scope of the code to be debugged.
Steps to set a breakpoint on the event listener:
Click to switch to Sources tab;
Expand the Event Listener Breakpoints option in the debugger area;
Select an event listener from the event list to set a breakpoint. There is a button click event in our program. Here we select click in the Mouse event option.
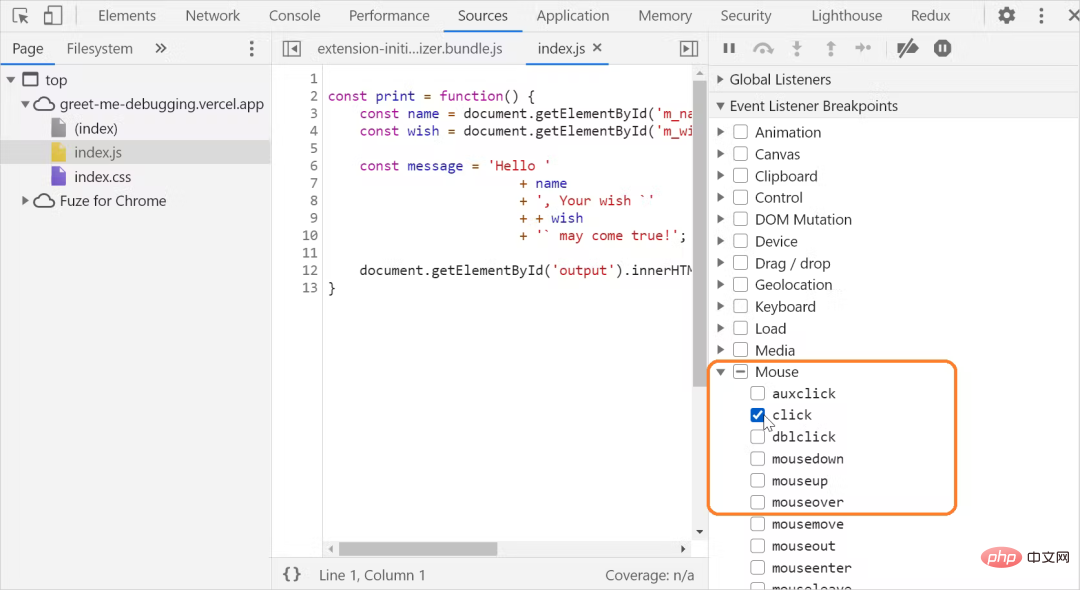
Tip: This option can be used when we want to pause the event listener code that runs after the event fires.
DevTools is also powerful in DOM inspection and debugging. You can set breakpoints to pause code execution when something is added, deleted, or modified in the DOM.
Steps to set a breakpoint on the DOM:
Click to switch to the Elements tab;
Find the one you want to set Breakpoint element;
Right-click the element to get the context menu, select the Break on option, and then select one of Subtree modifications, Attribute modifications, and Node removal:
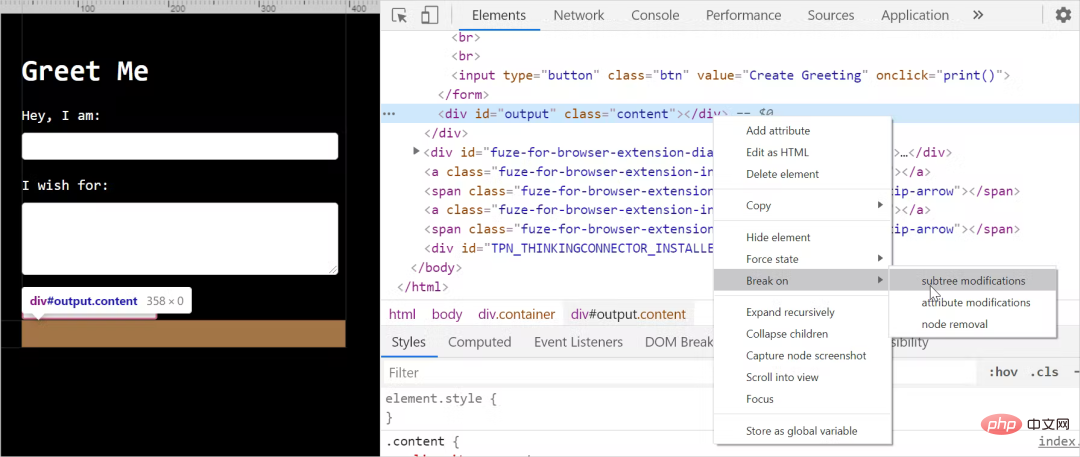
The meanings of these three options are as follows:
Subtree modifications: Breakpoint when the internal child nodes of the node change ;
Attribute modifications: Breakpoint when node attributes change;
Node removal: Breakpoint when node is removed.
As shown above, we set a breakpoint when the DOM of p in the output message changes. When the button is clicked, the greeting message is output to p, and if the content of the child node changes, an interruption will occur.
Note: This option can be used when we suspect that DOM changes cause errors. When DOM changes are interrupted, the execution of the relevant JavaScript code will be automatically suspended.
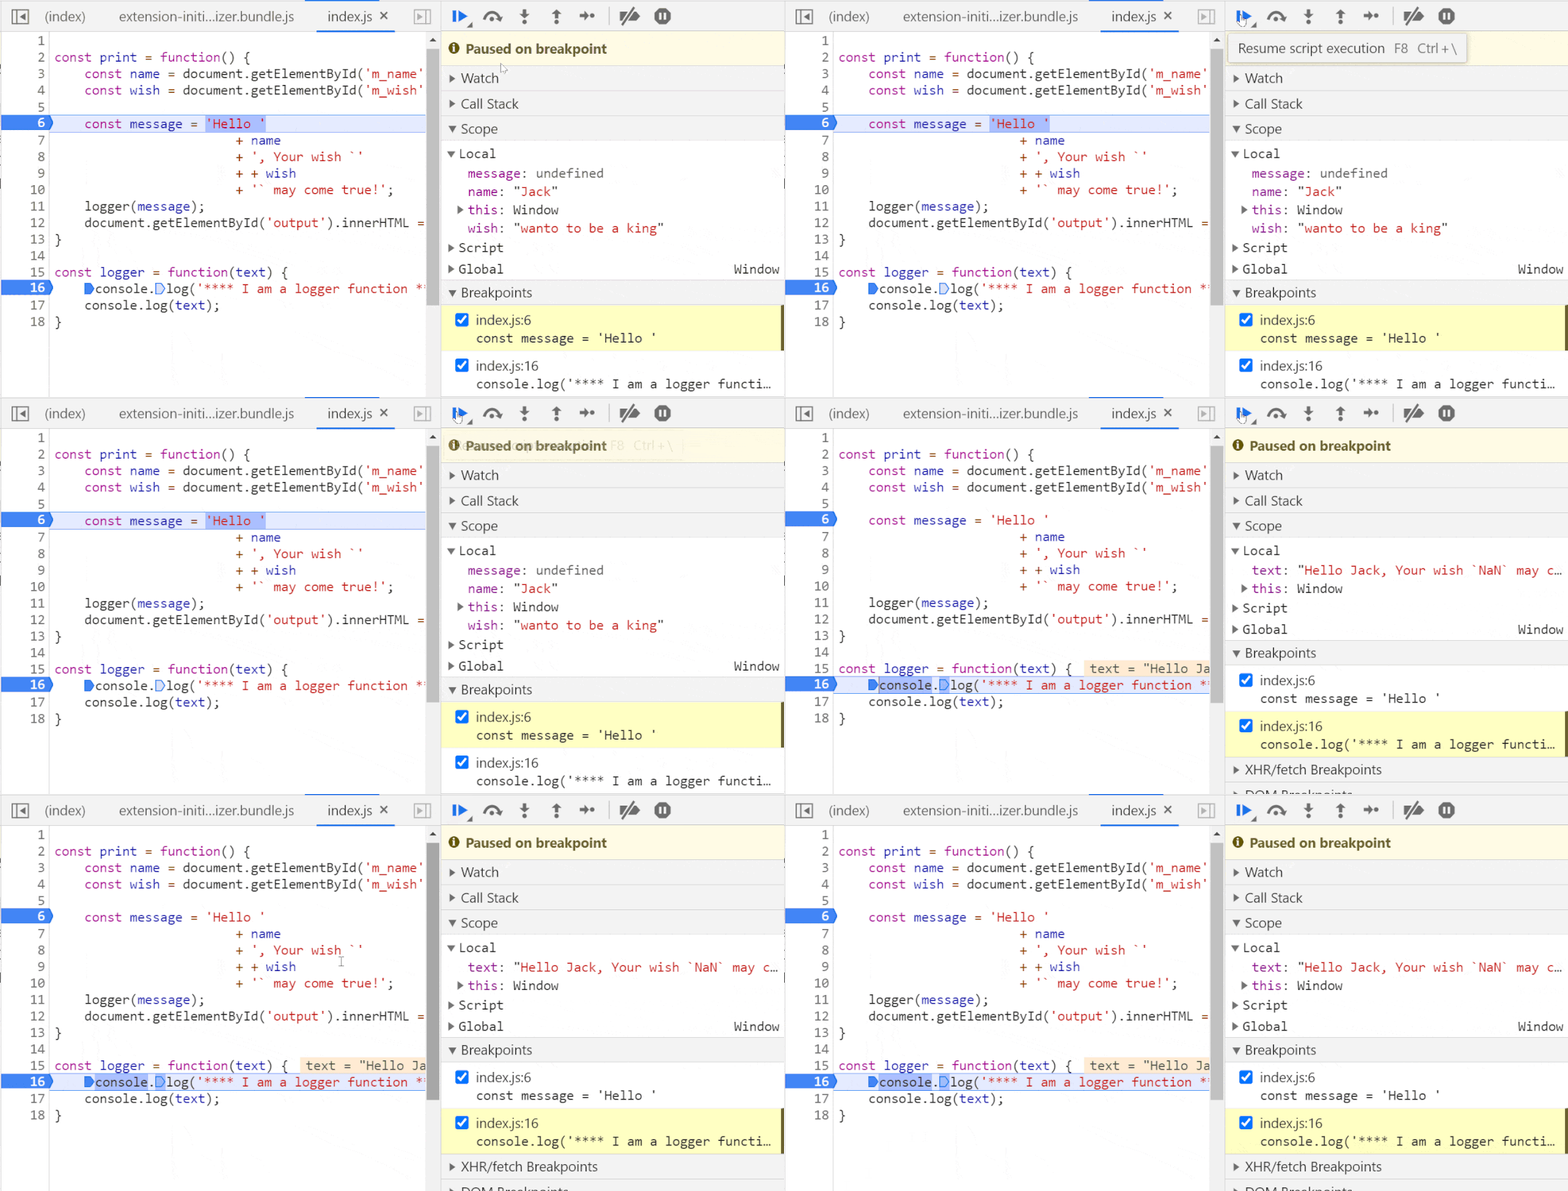
Now we know how to set breakpoints. In complex debugging situations we may need to use a combination of these debuggings. The debugger provides five controls to execute the code step by step:

Let’s take a look at how to use these controls.
This option allows us to execute the JavaScript code line by line when it is executed. If there is a function call in the middle, single-step execution will also enter the function. , execute line by line, and then exit.
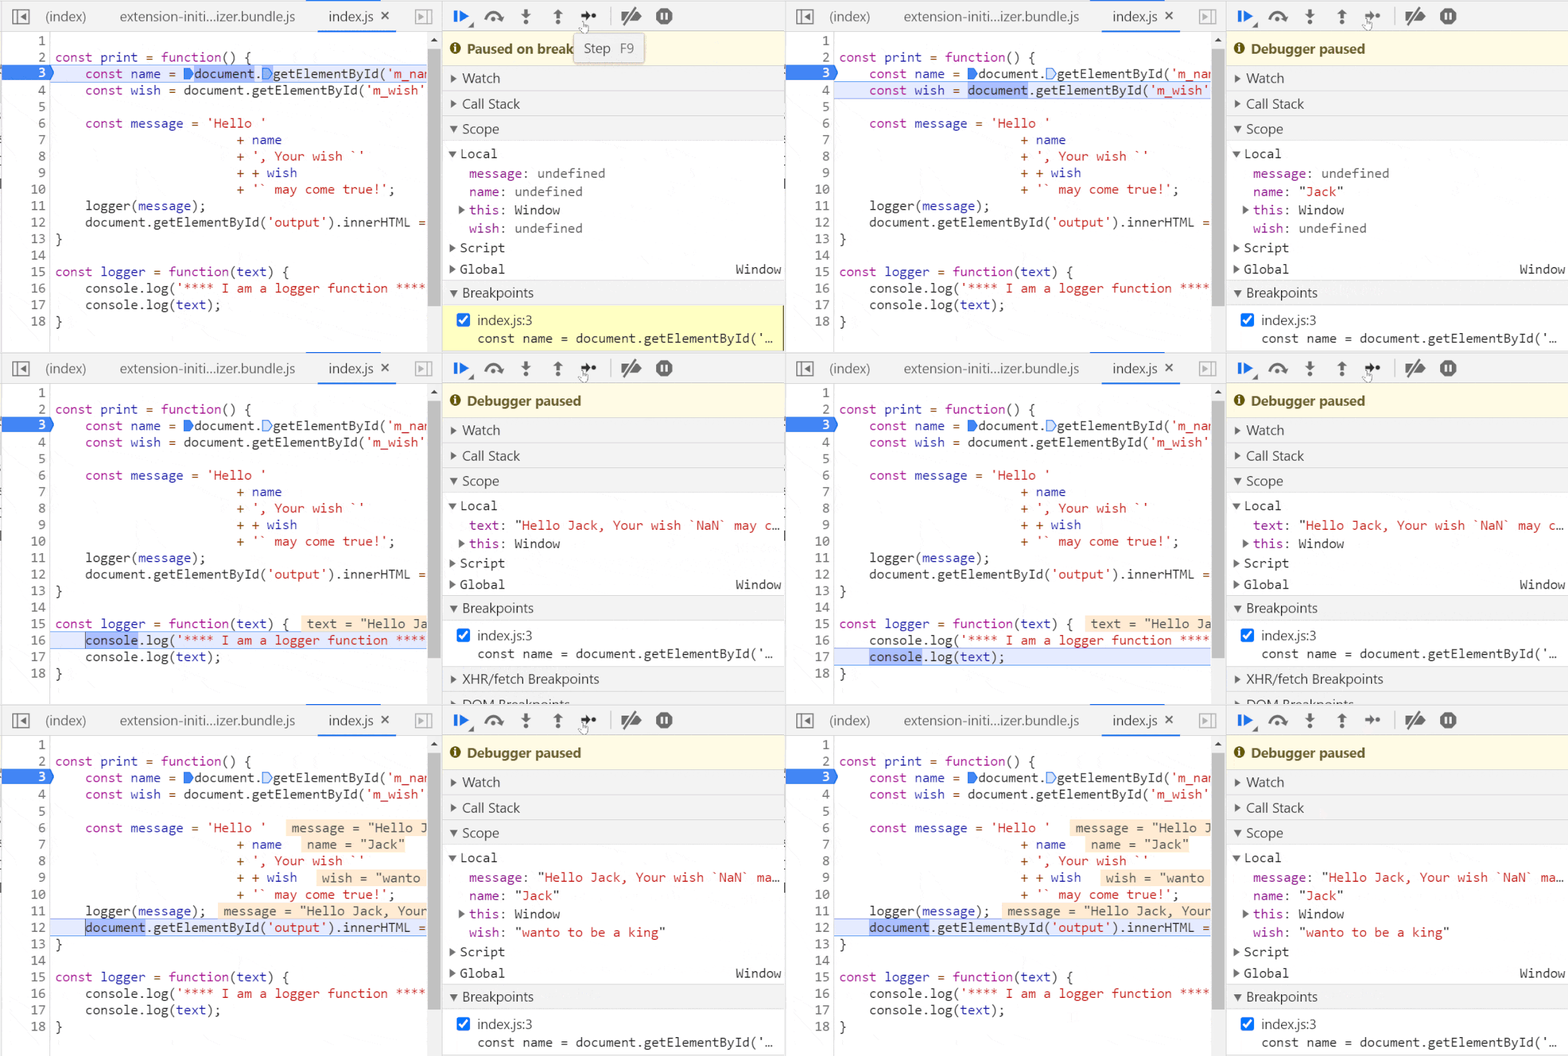
This option allows us to skip some code when executing the code. Sometimes we may have determined that certain features are normal and don't want to take the time to check them, so we can use the skip option.
The following is the single-step execution of the logger() function, which will skip the execution of the function:

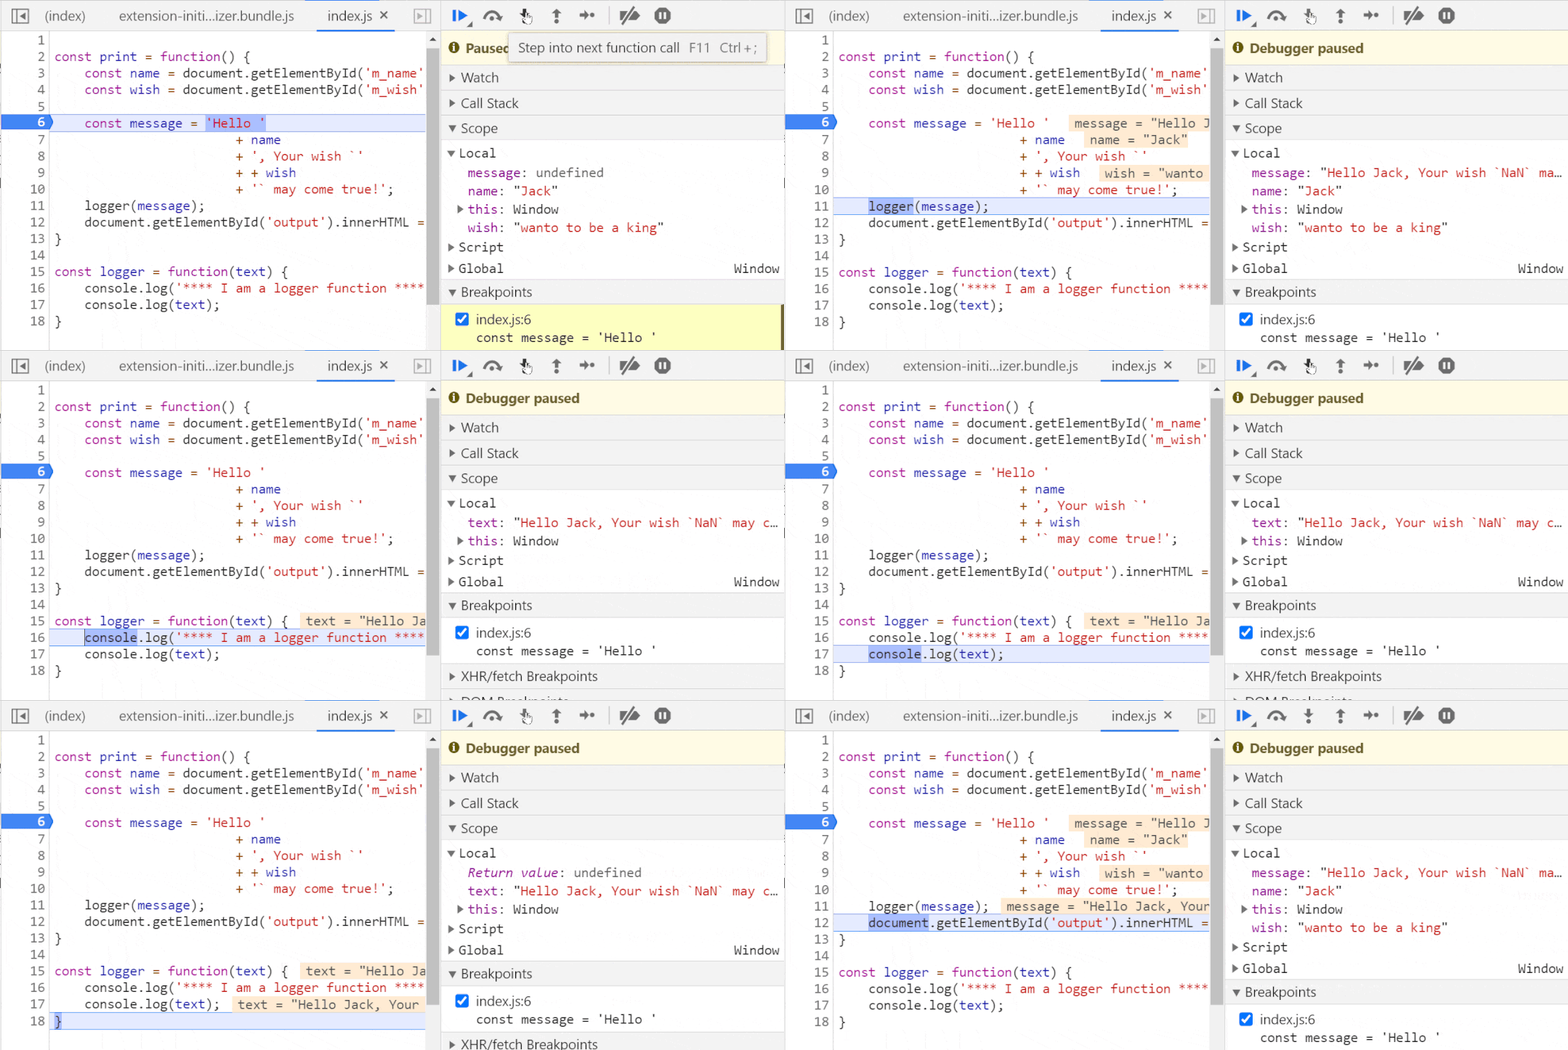
Use this option to gain more insight into the function. When stepping into a function, you can use this option to get inside the function and debug it when you feel that a function is behaving strangely and want to examine it.
The following is the single-step execution of the logger() function:
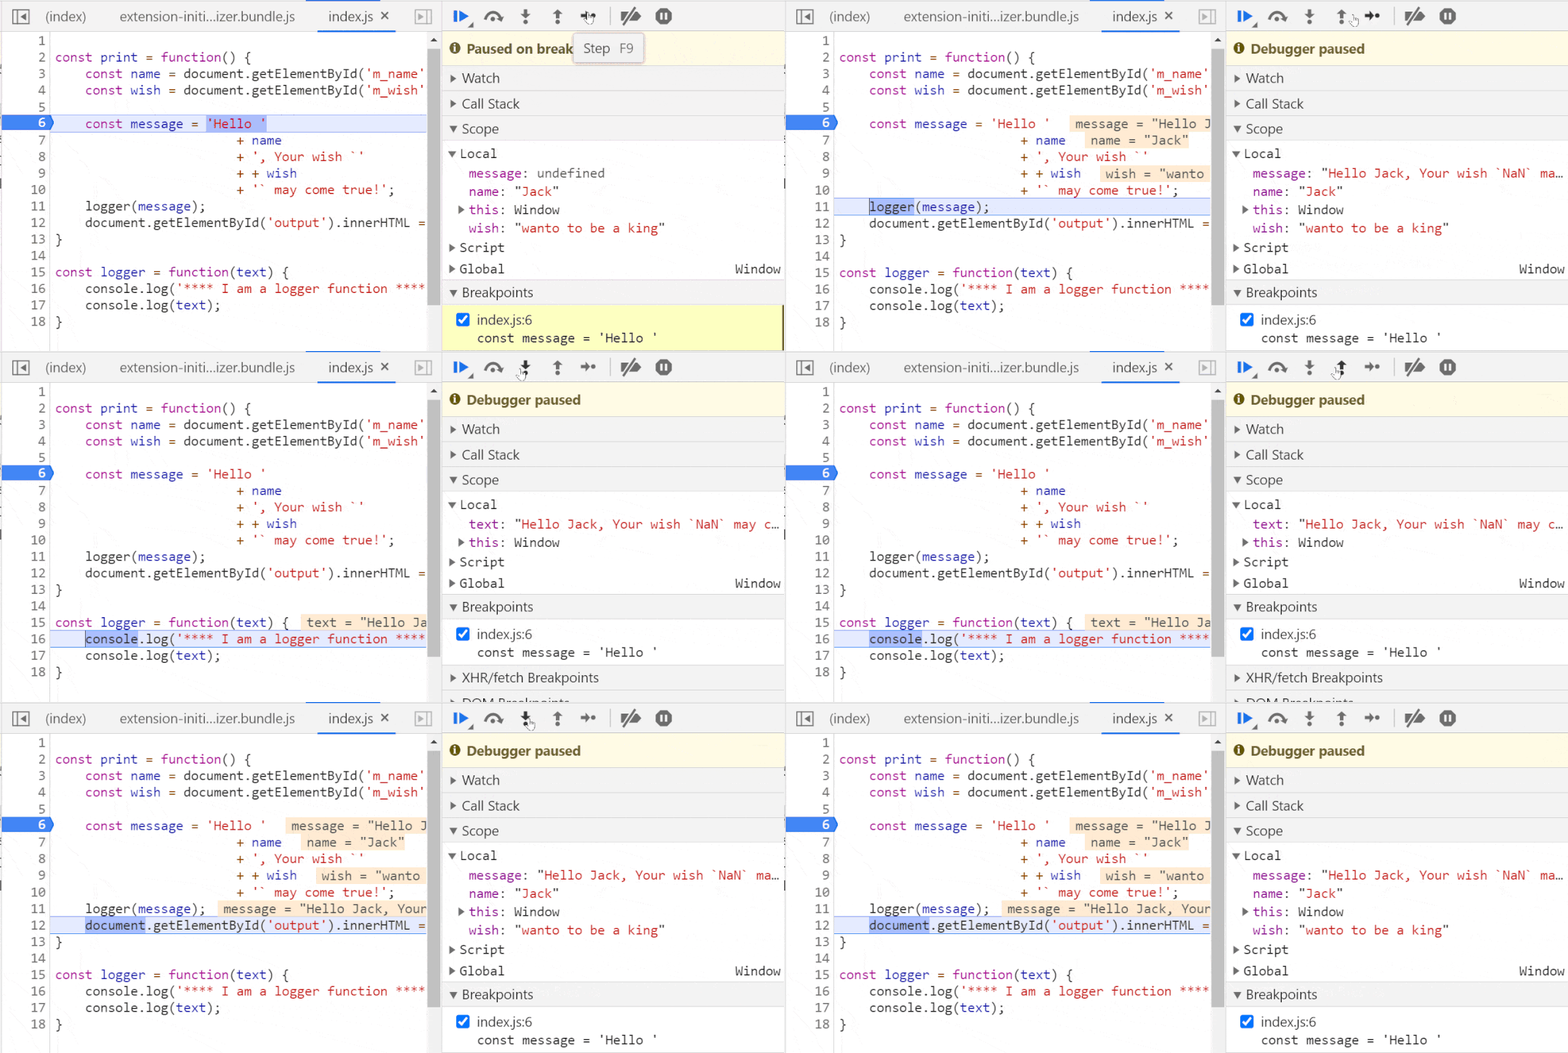
In single step When executing a function, we may not want to continue execution and exit it, so we can use these options to exit the function.
The following is to enter the logger() function, and then exit immediately:
Sometimes, we want to jump from one breakpoint to another without any debugging in between, we can use this option to jump to the next breakpoint:
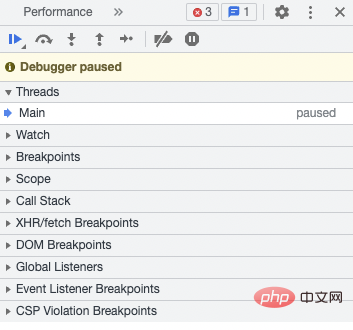
When performing line-by-line debugging, check the scope and value of the variable and the call stack of the function call. These three options are available in the Debugger area:
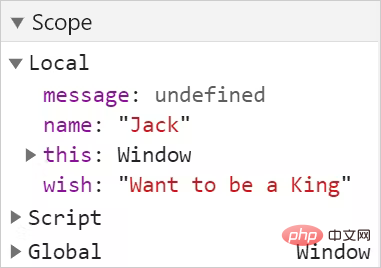
You can view the contents and variables in the local scope and global scope in the Scope option, and you can also see the real-time pointing of this:
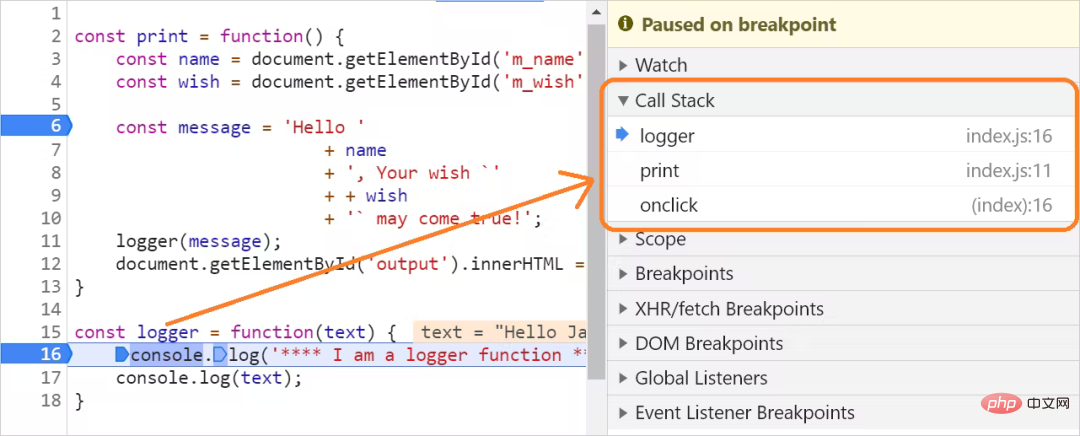
The call stack panel helps identify the function execution stack:
Checking values in your code is the primary way to identify errors in your code. While stepping through, we can check the value by just hovering over the variable.
Below you can see the check value of the variable name when the code is executed:

In addition, we can choose a part of the code as an expression to check the value . In the following example, the expression document.getElementById('m_wish') is selected to check the value:
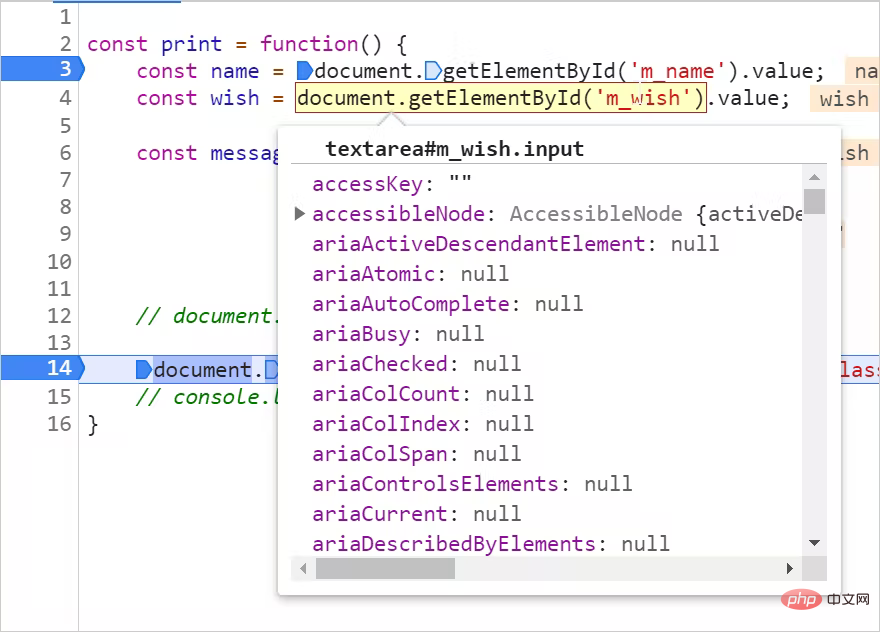
Watch section allows adding One or more expressions and monitor their values as they are executed. This feature is very useful when we want to do some calculations outside the code logic. We can combine any variables from a region of code to form a valid JavaScript expression. As you step through execution, you can see the value of the expression.
Here are the steps to add a Watch:
Click the button on the Watch:

Add expressions to monitor. In this example, a variable whose value you wish to observe is added:

Another way to observe the value of an expression is from the console Add in the console:

You can click the following button to disable all breakpoints:
 Note that the above method will not delete the breakpoints, it will only temporarily deactivate them. To activate these breakpoints again, just click the breakpoint again.
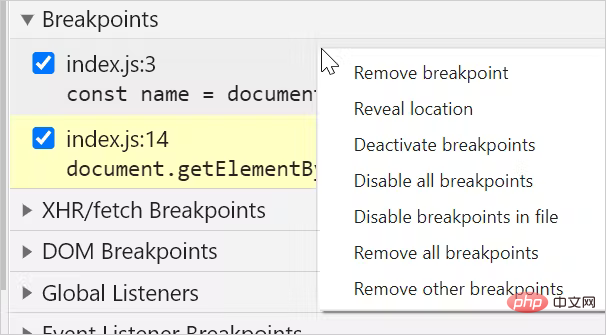
One or more breakpoints can be removed from the Breakpoints panel by unchecking the checkbox. All breakpoints can be deleted by right-clicking and selecting the "Delete all breakpoints" option:
Visual Studio Some practical plug-ins in code can be used for debugging JavaScript code. You can install a plugin called "Debugger for Chrome" to debug your code:

After installation, click on the run option on the left and create a configuration to run/debug JavaScript applications program.

This will create a file named launch.json, which contains some setting information:
{
  "version": "0.2.0",
  "configurations": [
      {
          "type": "chrome",
          "request": "launch",
          "name": "Debug the Greet Me app",
          "url": "<http://localhost:5500>",
          "webRoot": "${workspaceFolder}"
      }
  ]
}The following parameters can be modified:
name: any name;
url: URL running locally;
webRoot: the default value is $ {workspaceFolder}, the current folder. It may be possible to change it to a project entry file.
The last step is to start debugging by clicking the play icon in the upper left corner:

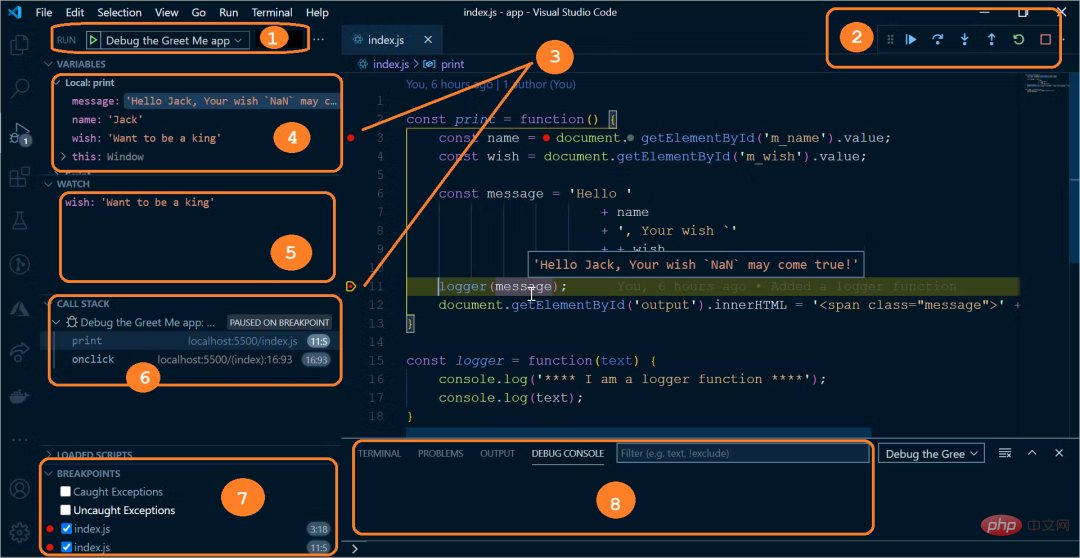
This debugger is similar to DevTools and mainly includes Following section:
Enable debugging. Press the play button to enable debugging options.
Controls for stepping through breakpoints and pausing or stopping debugging.
Set a breakpoint on the source code.
Scope panel to view variable ranges and values.
Watch panel for creating and monitoring expressions.
The call stack of the executed function.
List of breakpoints to enable, disable and remove.
Debug console reads console log messages.
最后,回到最开始的问题,这里不再一步步调试,通过上述的调试方法判定,只需要在 wish 变量前面加一个 + 即可:
const message = 'Hello '
                        + name
                        + ', Your wish `'
                        + + wish
+ '` may come true!';相关推荐:javascript学习教程
The above is the detailed content of Super practical JavaScript debugging skills. For more information, please follow other related articles on the PHP Chinese website!