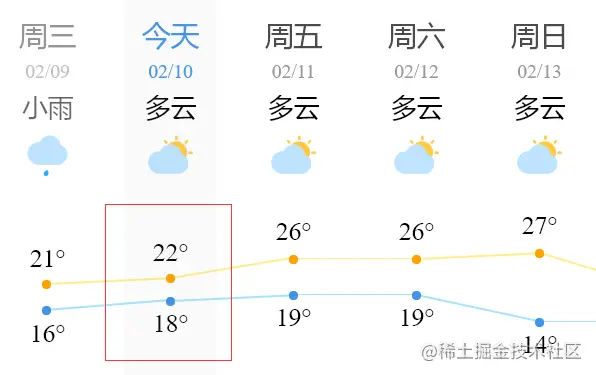
How to draw a weather line chart in WeChat applet? The following article will introduce to you how to use canvas to draw a weather line chart in the WeChat applet, and use a third-order Bezier curve to fit the temperature points to make them smooth and have a background color at the bottom of the curve. I hope Helpful for everyone!

Rendering:
##Custom component line-chart
Component({ externalClasses: ['line-class'], properties: { width: String, height: String, data: Array, }, observers: { width() { // 这里监听 width 变化重绘 canvas // 动态传入 width 好像只能这样了.. const query = this.createSelectorQuery(); query .select('#line') .fields({ node: true, size: true }) .exec(res => { const canvas = res[0].node; const ctx = canvas.getContext('2d'); const width = res[0].width; // 画布宽度 const height = res[0].height; // 画布高度 console.log(`宽度: ${width}, 高度: ${height}`); const dpr = wx.getSystemInfoSync().pixelRatio; canvas.width = width * dpr; canvas.height = height * dpr; ctx.scale(dpr, dpr); // 开始绘图 this.drawLine(ctx, width, height, this.data.data); }); }, }, methods: { drawLine(ctx, width, height, data) { const Max = Math.max(...data); const Min = Math.min(...data); // 把 canvas 的宽度, 高度按一定规则平分 const startX = width / (data.length * 2), // 起始点的横坐标 X baseY = height * 0.9, // 基线纵坐标 Y diffX = width / data.length, diffY = (height * 0.7) / (Max - Min); // 高度预留 0.2 写温度 ctx.beginPath(); ctx.textAlign = 'center'; ctx.font = '13px Microsoft YaHei'; ctx.lineWidth = 2; ctx.strokeStyle = '#ABDCFF'; // 画折线图的线 data.forEach((item, index) => { const x = startX + diffX * index, y = baseY - (item - Min) * diffY; ctx.fillText(`${item}°`, x, y - 10); ctx.lineTo(x, y); }); ctx.stroke(); // 画折线图背景 ctx.lineTo(startX + (data.length - 1) * diffX, baseY); // 基线终点 ctx.lineTo(startX, baseY); // 基线起点 const lingrad = ctx.createLinearGradient(0, 0, 0, height * 0.7); lingrad.addColorStop(0, 'rgba(255,255,255,0.9)'); lingrad.addColorStop(1, 'rgba(171,220,255,0)'); ctx.fillStyle = lingrad; ctx.fill(); // 画折线图上的小圆点 ctx.beginPath(); data.forEach((item, index) => { const x = startX + diffX * index, y = baseY - (item - Min) * diffY; ctx.moveTo(x, y); ctx.arc(x, y, 3, 0, 2 * Math.PI); }); ctx.fillStyle = '#0396FF'; ctx.fill(); }, }, });
// 获取 scroll-view 的总宽度 wx.createSelectorQuery() .select('.hourly') .boundingClientRect(rect => { this.setData({ scrollWidth: rect.right - rect.left, }); }) .exec();
小时概述 {{item}}
.scroll { position: relative; height: 150px; width: 100%; } .hourly { display: flex; height: 150px; position: absolute; top: 0; } .hourly > view { min-width: 3.5em; text-align: center; } .line { // 折线图绝对定位到底部 position: absolute; bottom: 0; }

Rendering
Calculate control points
First write a point classclass Point { constructor(x, y) { this.x = x; this.y = y; } }
Canvas Bezier curve drawing tool (karlew.com) http://wx.karlew.com/canvas/bezier/You can know the meaning of each parameter of the third-order Bezier curve through the above website
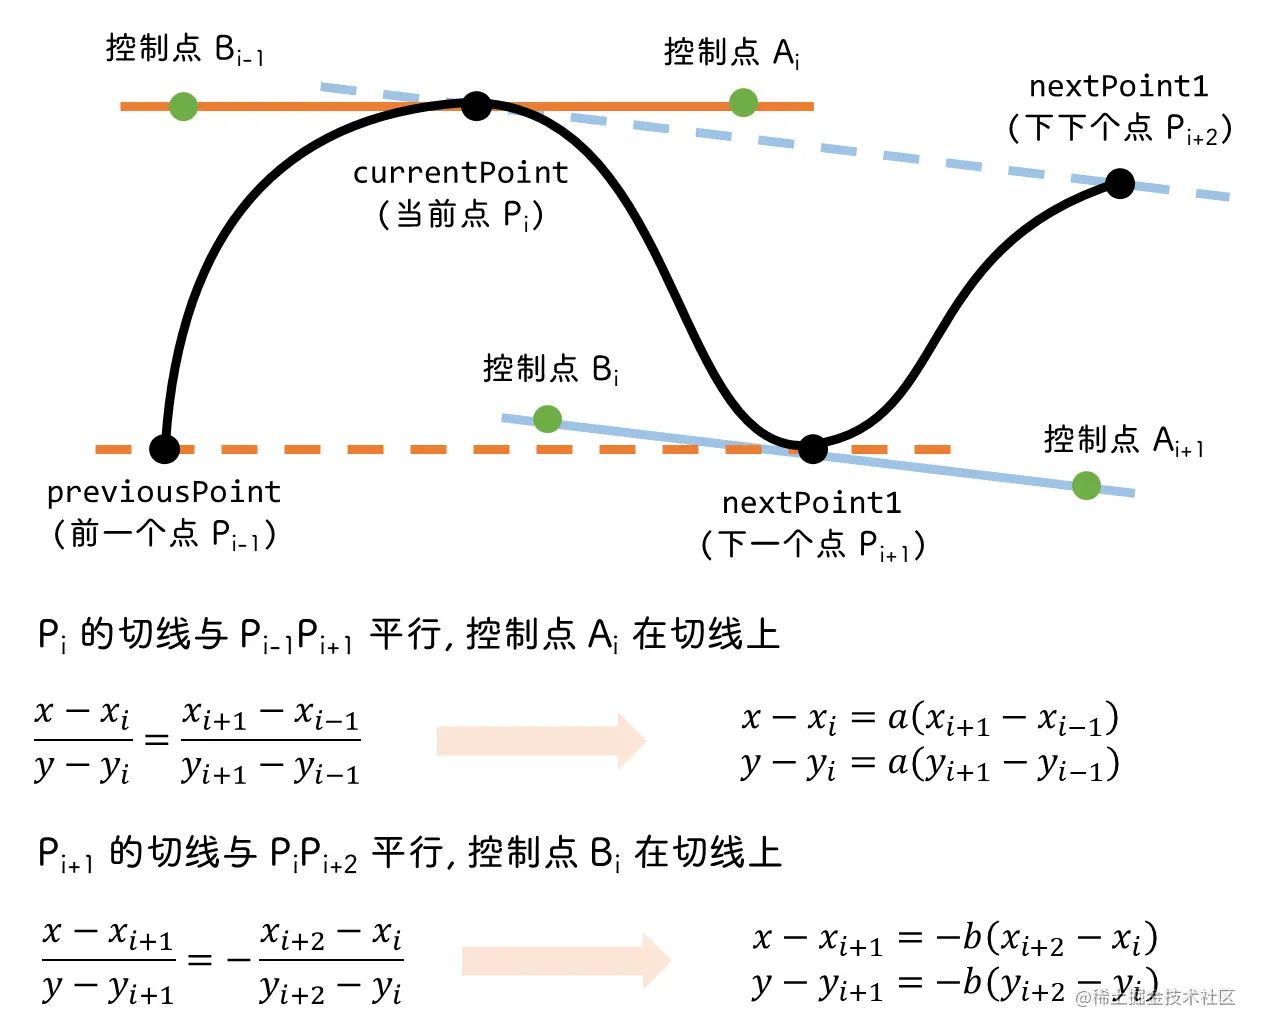
Calculation reference of control points: Bezier curve control points Determined method - Baidu Library https://wenku.baidu.com/view/c790f8d46bec0975f565e211.htmlCondensed it is

/** * 计算当前点的贝塞尔曲线控制点 * @param {Point} previousPoint: 前一个点 * @param {Point} currentPoint: 当前点 * @param {Point} nextPoint1: 下一个点 * @param {Point} nextPoint2: 下下个点 * @param {Number} scale: 系数 */ calcBezierControlPoints( previousPoint, currentPoint, nextPoint1, nextPoint2, scale = 0.25 ) { let x = currentPoint.x + scale * (nextPoint1.x - previousPoint.x); let y = currentPoint.y + scale * (nextPoint1.y - previousPoint.y); const controlPointA = new Point(x, y); // 控制点 A x = nextPoint1.x - scale * (nextPoint2.x - currentPoint.x); y = nextPoint1.y - scale * (nextPoint2.y - currentPoint.y); const controlPointB = new Point(x, y); // 控制点 B return { controlPointA, controlPointB }; }
/** * 绘制贝塞尔曲线 * ctx.bezierCurveTo(控制点1, 控制点2, 当前点); */ drawBezierLine(ctx, data, options) { const { startX, diffX, baseY, diffY, Min } = options; ctx.beginPath(); // 先移动到第一个点 ctx.moveTo(startX, baseY - (data[0] - Min) * diffY); data.forEach((e, i) => { let curPoint, prePoint, nextPoint1, nextPoint2, x, y; // 当前点 x = startX + diffX * i; y = baseY - (e - Min) * diffY; curPoint = new Point(x, y); // 前一个点 x = startX + diffX * (i - 1); y = baseY - (data[i - 1] - Min) * diffY; prePoint = new Point(x, y); // 下一个点 x = startX + diffX * (i + 1); y = baseY - (data[i + 1] - Min) * diffY; nextPoint1 = new Point(x, y); // 下下个点 x = startX + diffX * (i + 2); y = baseY - (data[i + 2] - Min) * diffY; nextPoint2 = new Point(x, y); if (i === 0) { // 如果是第一个点, 则前一个点用当前点代替 prePoint = curPoint; } else if (i === data.length - 2) { // 如果是倒数第二个点, 则下下个点用下一个点代替 nextPoint2 = nextPoint1; } else if (i === data.length - 1) { // 最后一个点直接退出 return; } const { controlPointA, controlPointB } = this.calcBezierControlPoints( prePoint, curPoint, nextPoint1, nextPoint2 ); ctx.bezierCurveTo( controlPointA.x, controlPointA.y, controlPointB.x, controlPointB.y, nextPoint1.x, nextPoint1.y ); }); ctx.stroke(); },
applet Development Tutorial】
The above is the detailed content of Teach you step by step how to use canvas to draw a weather line chart in the WeChat applet (with code). For more information, please follow other related articles on the PHP Chinese website!
 What are the production methods of html5 animation production?
 Which is more difficult, c language or python?
 How to update graphics card driver
 How to use the average function
 Win10 My Computer Icon Retrieval Tutorial
 The difference between get request and post request
 What software is autocad?
 rgb to hexadecimal rgb