
First of all, among various browsers, Firefox has the best support for breakpoint debugging. Firefox can not only use Firebug to debug page js scripts, but also use advanced debugging tools such as JavaScript Debugger (Venkman) to debug Firefox extensions. js. In addition, Firefox also supports some more advanced breakpoint debugging and variable monitoring functions.
Among other browsers, the debugging functions of Opera, Chrome and Safari are also relatively easy to use. Opera's DragonFly is relatively fast, has a clean interface, and has powerful functions, but it is not as user-friendly as Safari. In comparison, IE8's programmer tools are simply useless.
Time is limited this time, so let’s first summarize the debugging skills under Firefox.
1. Use Firebug for breakpoint debugging
Debugging JavaScript with Firebug is very convenient. Specific steps:
a. After opening Firebug, enable "script" debugging and find the referenced script file (or inline js);
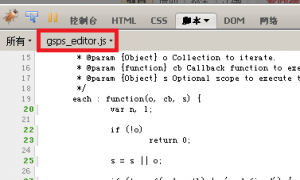
Use Firebug to find the script you want to debug (click to enlarge)
b. Add breakpoints at appropriate locations;
c. If the breakpoint has been executed, refresh the page and the script will interrupt at the breakpoint. If the breakpoint has not been executed, you can directly execute the action on the page (such as clicking a button, etc.), and then the code will interrupt at the breakpoint;

Use Firebug for breakpoint debugging (click to enlarge)
d. Observe the function call stack, observe local variables, and perform single-step execution for debugging.
It’s really simple! The advantages of debugging with Firebug breakpoints are summarized as follows:
The lines where breakpoints can be added are numbered in green, which is very intuitive;
The call stack is displayed in two ways, which is very convenient;
The display of local variables is very clear and concise.
2. Use JavaScript Debugger for breakpoint debugging
This is an old debugging tool, formerly called Venkman, which can be installed on Firefox in the form of an extension. Let’s call it Venkman here. It can not only debug page scripts, but also debug js in Firefox extensions. When we are doing Firefox extension development, Venkman is an indispensable tool, Lao Tian strongly recommends it! Of course, the logic implementation of Firefox itself is also done in JavaScript. We can now use Venkman to debug Firefox itself. The core js of Firefox is browser.js, which is under this path:
chrome://browser/content/browser.js
After we open Venkman, fill in browser.js in Loaded Scripts, and this js file will be filtered out (if you don’t see browser.js, you may need to check whether Debug->Exclude is selected browser files).
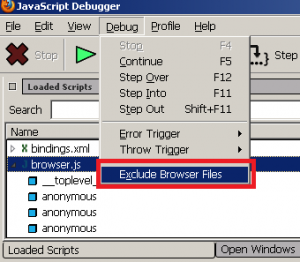
Venkman: Select the js file to be debugged (click to enlarge)
We find the code that makes the browser go back, and then click the Firefox back button. At this time, Venkman will stop at the BrowserBack method! Let's take a step-by-step look at what Firefox does. btw, isn’t the js code that implements Firefox very beautiful~~~
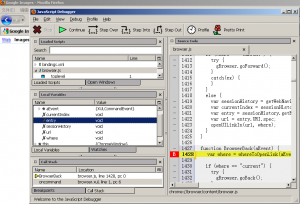
Debug Firefox with JavaScript Debugger breakpoints (click to enlarge)
Of course Venkman also comes with a console. Using this console, we can take a look at what the window and document are at the browser level. Similar to the console of Firebug and other browsers, just enter the js code snippet directly!
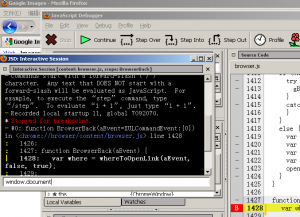
Use the console that comes with Venkman (click to enlarge)
If you are interested, you can discover more interesting things about Firefox development (and extension development) here!
3. Use debugger to add breakpoints in the program
There is also a little-known method of adding breakpoints. We can add a debugger statement to the program, so that Firefox's debugging tool will stay on this statement and the code will pause execution, which has the same effect as adding a breakpoint. For example:
var myfunc = {
 get_field_value_callback : function() {
  debugger;
  var ed = this, target = ed.currSpan;
  /* do something more */
 }
}
When the page is reloaded, the breakpoint will stay on the debugger statement. In this way, we can add breakpoints as we like when writing code. In addition, other browsers (including IE8! Surprise!) also support the debugger statement!
Last time I summarized the techniques for debugging JavaScript breakpoints under Firefox. This time we will look at debugging under other browsers. A little explanation, the debugging skills here do not rely on tools other than the browser, such as Aptana, VS2008, etc. If you are looking for some information on this, I don’t have it here.
Other browsers, mainly Opera, Safari, Chrome and IE8. Except for IE8, their debugging functions are quite good. You can basically search scripts, add breakpoints, view call stacks, local variables, and powerful consoles.
1. Use Opera’s Dragonfly for breakpoint debugging
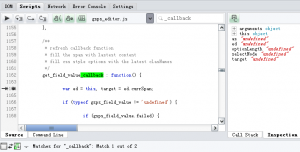
Use Opera Dragonfly for breakpoint debugging
Open Tools – Advanced – Developer Tools, and you will see a development tool similar to Firebug, called Dragonfly, which is dragonfly. Here you can view the page structure, view network interactions, and breakpoint debugging, and you can use the Command Line (console) during the debugging process.
Opera on WindowsXP is also an A-grade that YUI needs to support (see this table for details), so we must try our best to support it when developing. In addition, Dragonfly's DOM viewing tool has a highlight, Export current DOM view. We can make some DOM changes online and then export them to get the changed HTML code, which is very convenient.
2. Use Chrome and Safari for breakpoint debugging
If you think Opera is too niche, you can debug it on Safari or Chrome. The debugging methods and interfaces of the two browsers are very similar, so here we take Safari 4.0 as an example. Open Menu – Develop – Start Debugging JavaScript, and a debugging tool will pop up. It is worth mentioning that it is best not to dock the debugging tools of Safari and Chrome under the browser, because if they pop up, the debugging interface will be just right.
First find the script you want to debug:
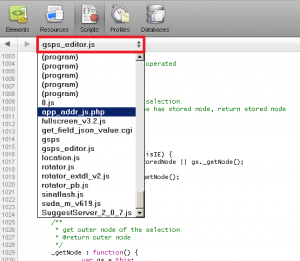
JavaScript debugging with Safari: Find the script
Set a breakpoint and reload the page (or perform an action):
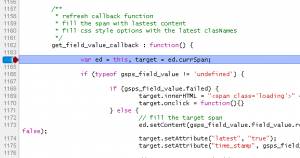
JavaScript debugging with Safari: Setting breakpoints
View local variables and function call stack on the right:
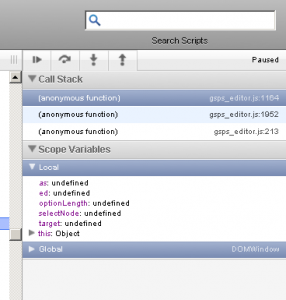
JavaScript Debugging with Safari: Variable View
A highlight of Safari’s debugging tool is that the console and breakpoint debugging are on the same interface, which makes it very convenient to use the console to do some verification operations when the program is interrupted.
3. Breakpoint debugging function of IE8
The developer tools that come with IE8, although extremely difficult to use, can also be used for breakpoint debugging. The method of breakpoint debugging is similar to the above.
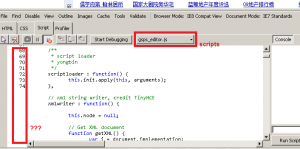
Use IE8 developer tools for breakpoint debugging
As you can see, IE8 seems to have terminated the recognition of js code inexplicably. In this case, there is no way to add breakpoints from line 74 onwards, which is incredible. But sometimes in order to be compatible with IE, we have to do some debugging under IE. What should we do? You can use the method in the previous article to add a debugger statement where the interruption is needed, so that when the program is running, IE8 will interrupt on the debugger statement.
The above content is the JavaScript debugging skills shared by the editor - Firefox power-off debugging. I hope you like it.


