

Introduction
1 Background
PHP's xhprof extension Facebook will no longer be updated and maintained because Facebook has fully used HHVM and no longer uses the PHP zend engine.
xhprof does not support the new version of PHP (PHP7). The tideways extension is maintained from the xhprof project fork and currently supports PHP 7.2, 7.1, 7.0, 5.6 and 5.5.
tideways is an open source project. It only charges for UI services. In fact, xhgui can fully meet our daily needs
# #2 Function
Tideways is an extension used to test PHP performance. It can obtain the functions called during the entire process of PHP execution, the number of function calls, execution time, CPU time, and memory usage. , memory peak, total execution time, total CPU time, total memory usage, total memory peak and other data, analyze the above data to find out the performance bottleneck of PHP, analyze the PHP execution process, etc.3 Advantages
4 Disadvantages
Although non-intrusive, if execution logs are generated for each interface, the consumption of CPU and memory is not negligible.5 Implementation principle
Application
Next, we will introduce two application methods:IntrusiveandNon-invasive
The intrusive type refers to adding code to the code, and the intrusive type uses the default UI; The non-intrusive type refers to adding code without making any changes to the code. Modify nginx/apache to implement code injection, using xhgui non-invasively; Installationtideways_xhprof
git clone "https://github.com/tideways/php-xhprof-extension.git" cd php-xhprof-extension phpize ./configure --with-php-config=/usr/local/php7/bin/php-config make sudo make install
##Non-intrusive:
Copy after login
Installs the default UI used to find data
git clone git@github.com:phacility/xhprof.git
andin this repository xhprof_htmldirectory into your web folder and navigate toxhprof_html/index.phpto see the trace list.If you want to see function call notes, you need to install Callgraph
Install CallgraphCallgraph is actually a combination of three tools become.
One is cflow or calltree which is used to generate C function call tree. The following mainly introduces cflow.
A tool for processing dot text graphics language, enhanced by graphviz.
A script for converting C function call tree to dot format: tree2dotx
Take Ubuntu as an example, install them separately:
sudo apt-get install cflow graphviz
Next install tree2dotx and Callgraph , here they are installed to /usr/local/bin by default.
wget -c https://github.com/tinyclub/linux-0.11-lab/raw/master/tools/tree2dotx wget -c https://github.com/tinyclub/linux-0.11-lab/raw/master/tools/callgraph sudo cp tree2dotx callgraph /usr/local/bin sudo chmod +x /usr/local/bin/{tree2dotx,callgraph}
The next two renderings are shown:
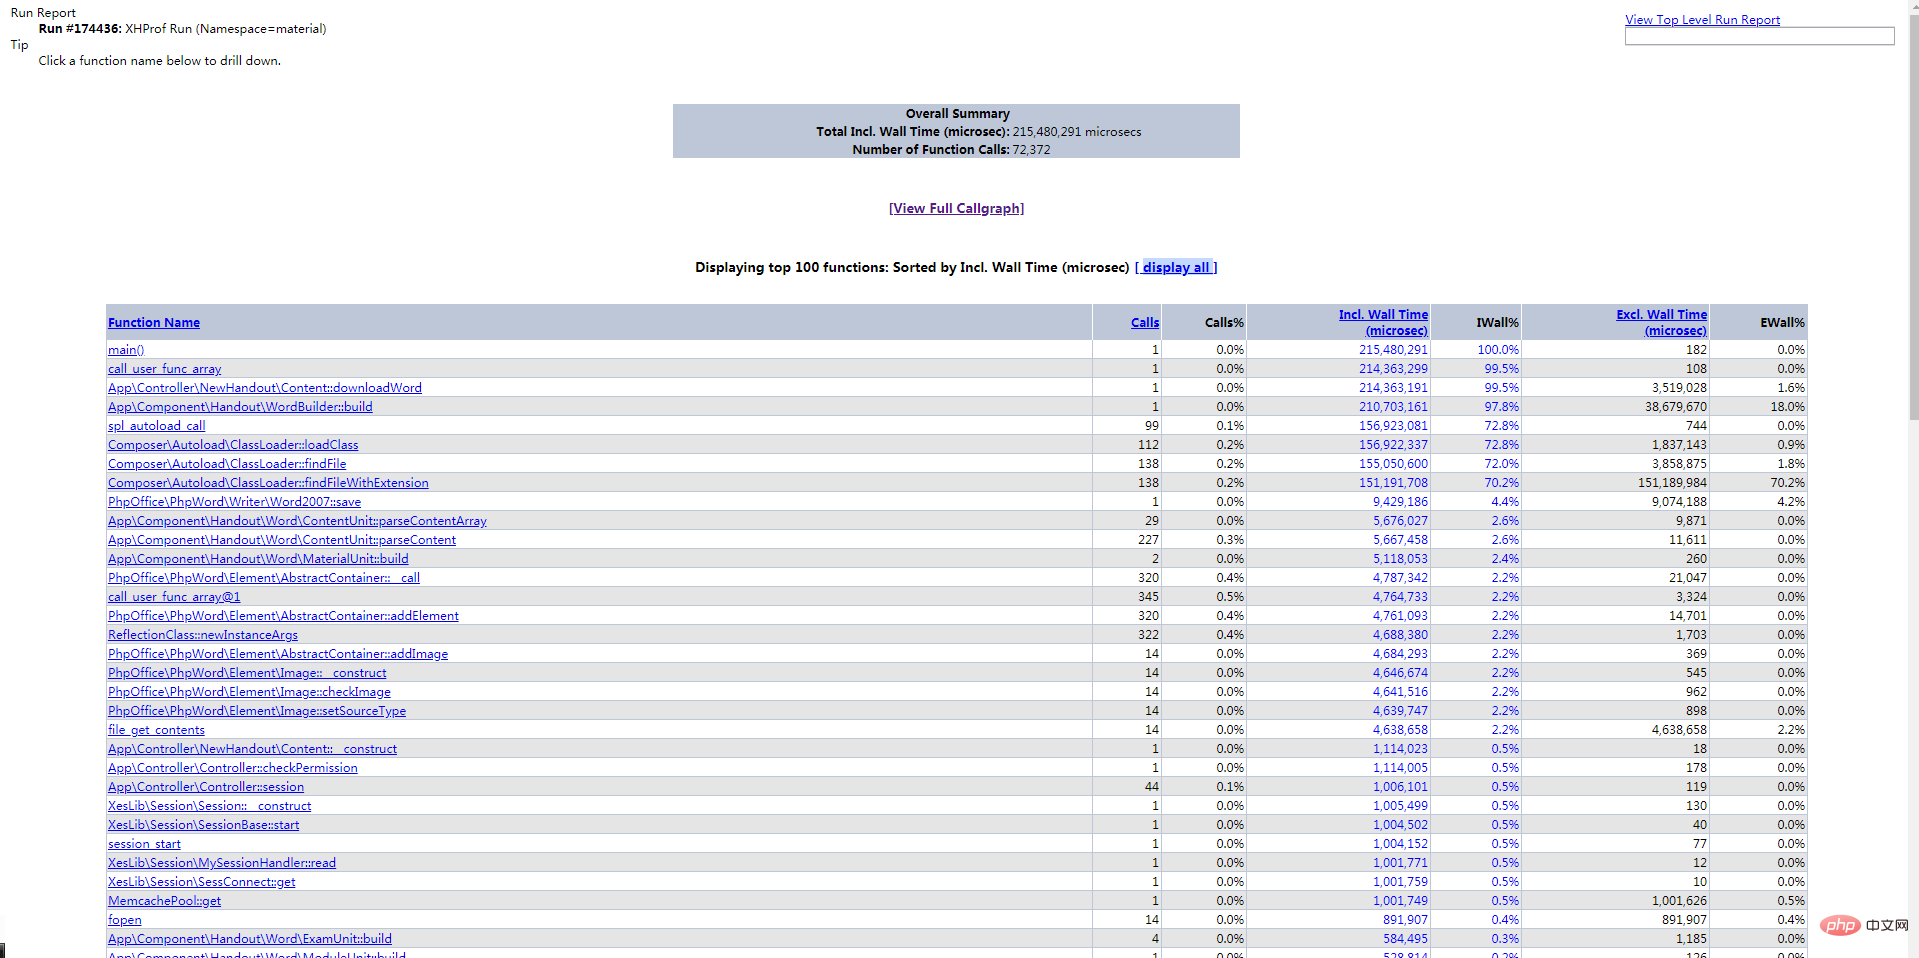
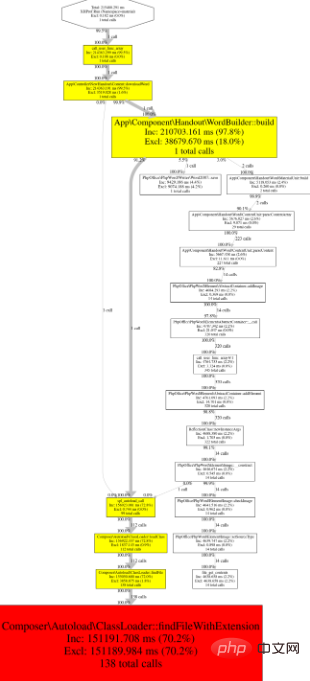
Intrusive:Intrusive use of xhgui requires mongodb
Install xhgui
git clone git@github.com:perftools/xhgui.git
Configure Nginx
server { listen 80; server_name site.localhost; root /Users/markstory/Sites/awesome-thing/app/webroot/; fastcgi_param PHP_VALUE "auto_prepend_file=/home/www/xhgui/external/header.php"; #这里依据个人目录而配 }
xhgui configuration (Frequency of generating logs)In xhgui’s config/config.default.php, the number of sampling hits can be set;
return rand(1, 100) === 42; 为1%的采样率,改成return True;则标识每次都采样
'profiler.enable' => function() { // url 中包含debug=1则百分百捕获 if(!empty($_GET['debug'])){ return True; }else{ // 1%采样 return rand(1, 100) === 42; } }
mongodb的配置
xhgui/config/config.default.php
// Can be either mongodb or file. /* 'save.handler' => 'file', 'save.handler.filename' => dirname(__DIR__) . '/cache/' . 'xhgui.data.' . microtime(true) . '_' . substr(md5($url), 0, 6), */ 'save.handler' => 'mongodb', // Needed for file save handler. Beware of file locking. You can adujst this file path // to reduce locking problems (eg uniqid, time ...) //'save.handler.filename' => __DIR__.'/../data/xhgui_'.date('Ymd').'.dat', 'db.host' => 'mongodb://127.0.0.1:27017', 'db.db' => 'xhprof',
mongo > use xhprof > db.results.ensureIndex( { 'meta.SERVER.REQUEST_TIME' : -1 } ) > db.results.ensureIndex( { 'profile.main().wt' : -1 } ) > db.results.ensureIndex( { 'profile.main().mu' : -1 } ) > db.results.ensureIndex( { 'profile.main().cpu' : -1 } ) > db.results.ensureIndex( { 'meta.url' : 1 } )
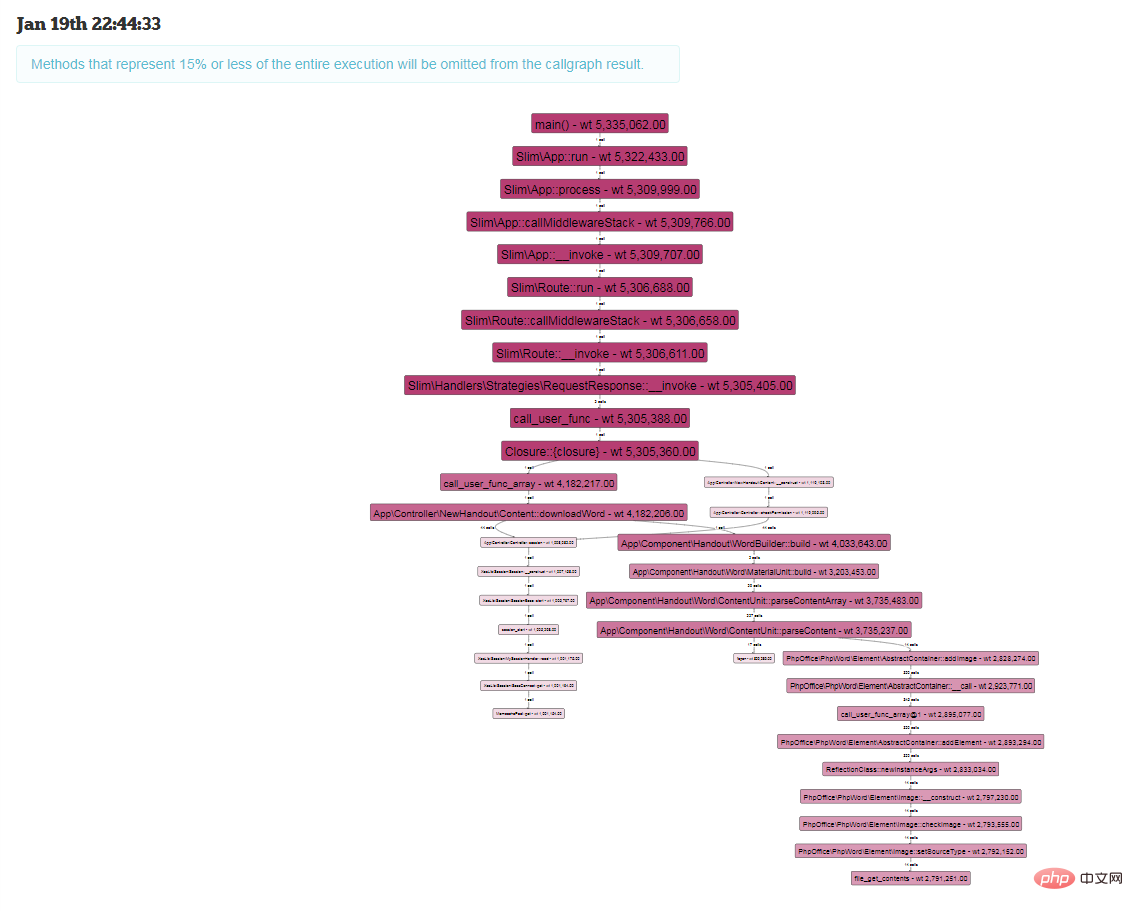
最后展示几张xhgui的效果图
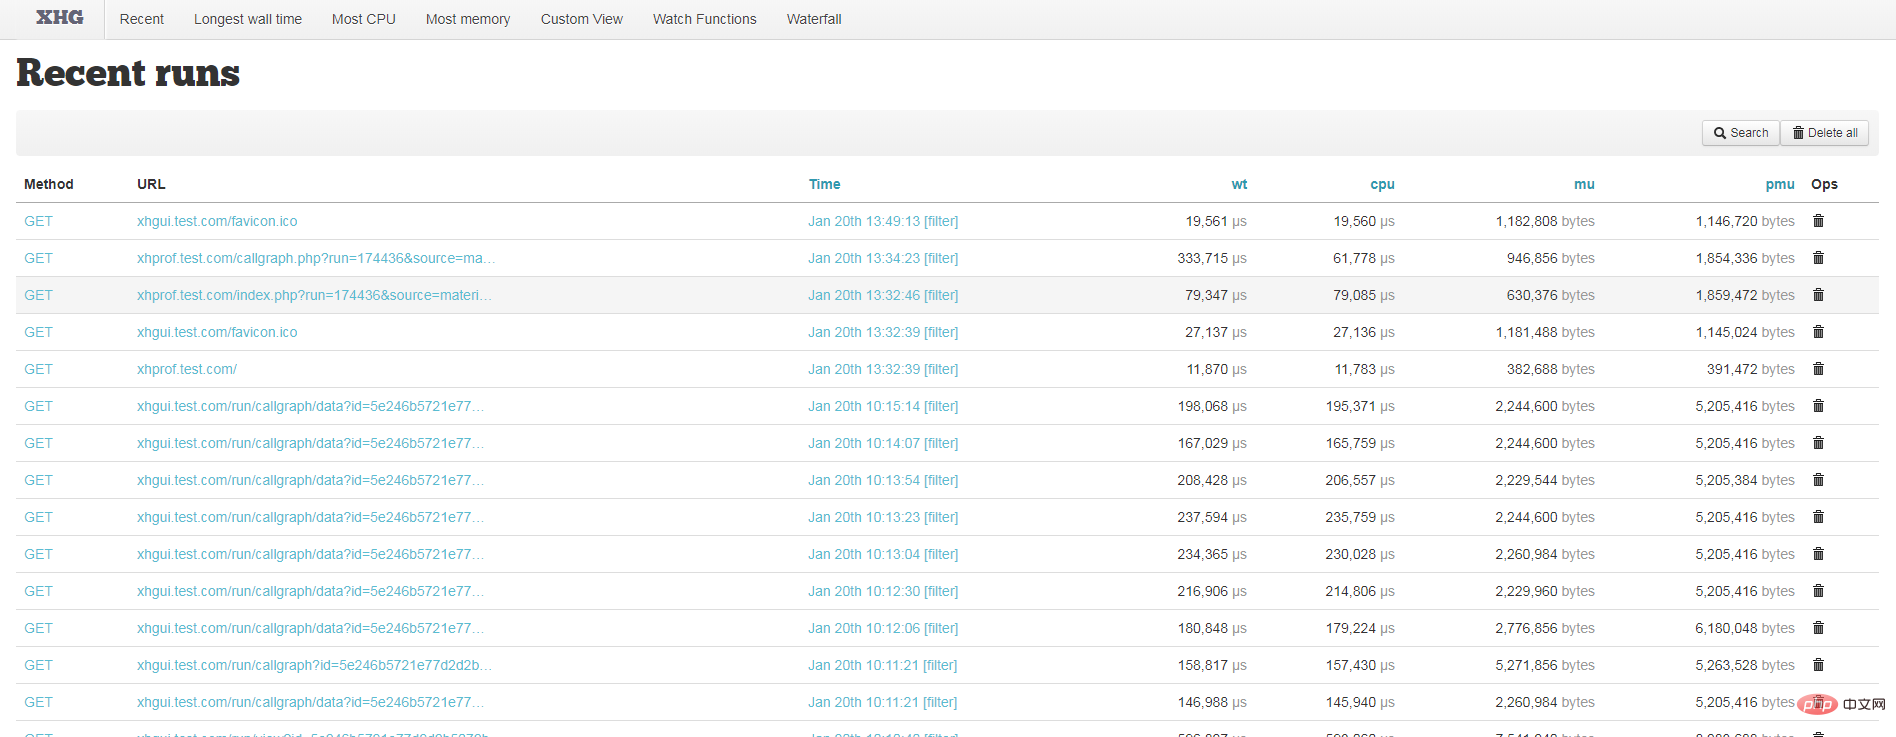
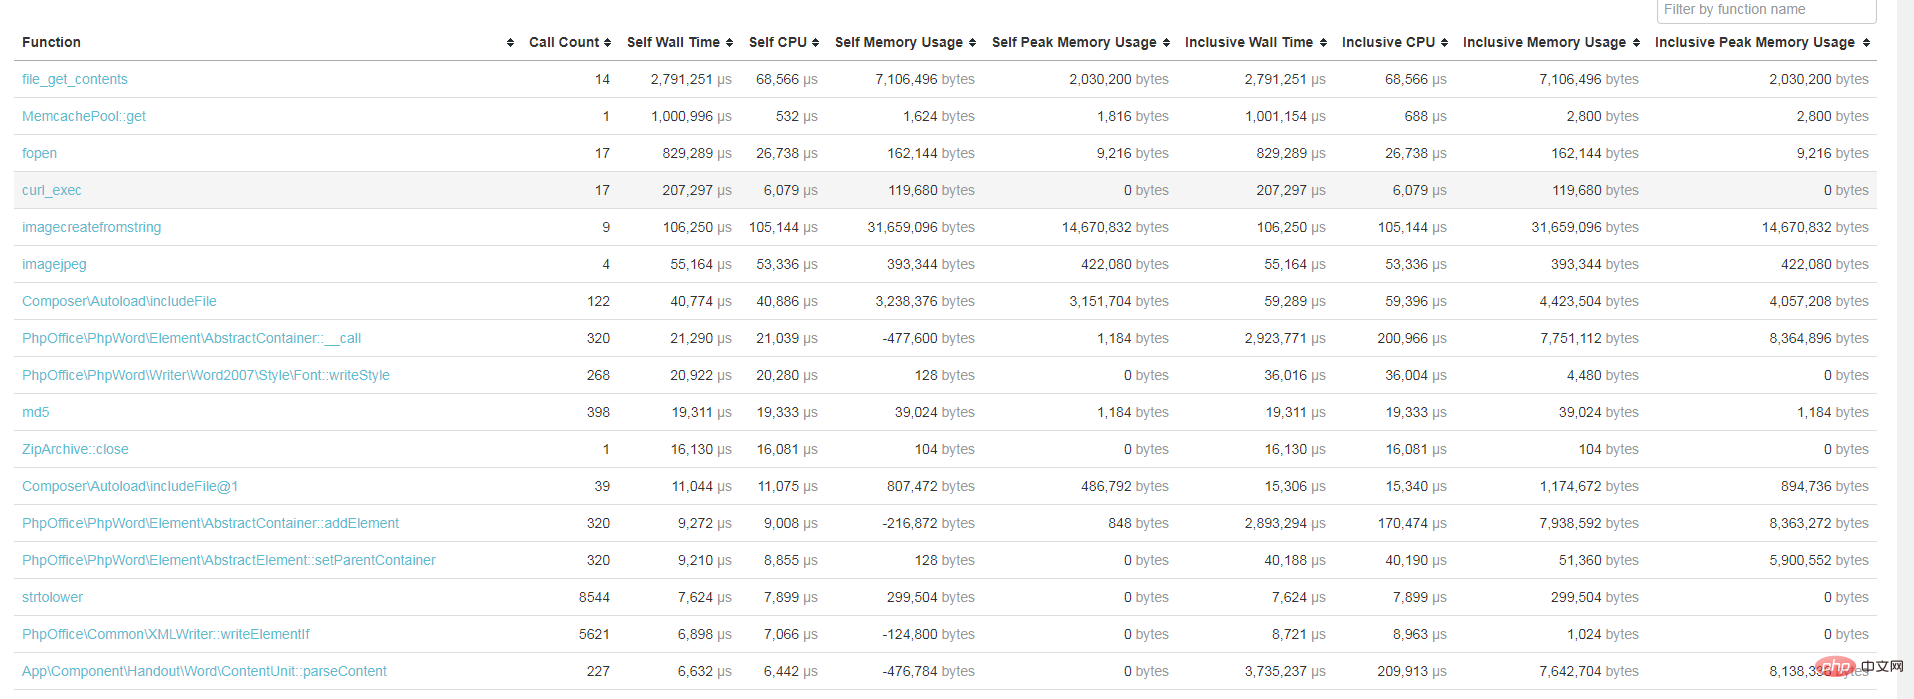
相关学习推荐:PHP编程从入门到精通
The above is the detailed content of How to use xhprof to test php performance in php7? (Method introduction). For more information, please follow other related articles on the PHP Chinese website!
 What is the difference between php5 and php7
 What is the difference between php7 and php8
 div scroll bar
 How to remove the first few elements of an array in php
 What are the uses of vue.js slots?
 How to decrypt bitlocker encryption
 What are the four main IO models in Java?
 How to solve the problem of missing ssleay32.dll