This article mainly introduces how to use NodeJS Lighthouse Gulp to build automated website performance testing tools. It has a certain reference value. Now I share it with you. Friends in need can refer to it.
Lighthouse is an open source tool owned by Google that can automatically detect website quality. It has a friendly interface, simple operation, diverse usage methods, and comprehensive perspectives. You can use it to test any web page. Normally Users, QA, and developers can all get started quickly.
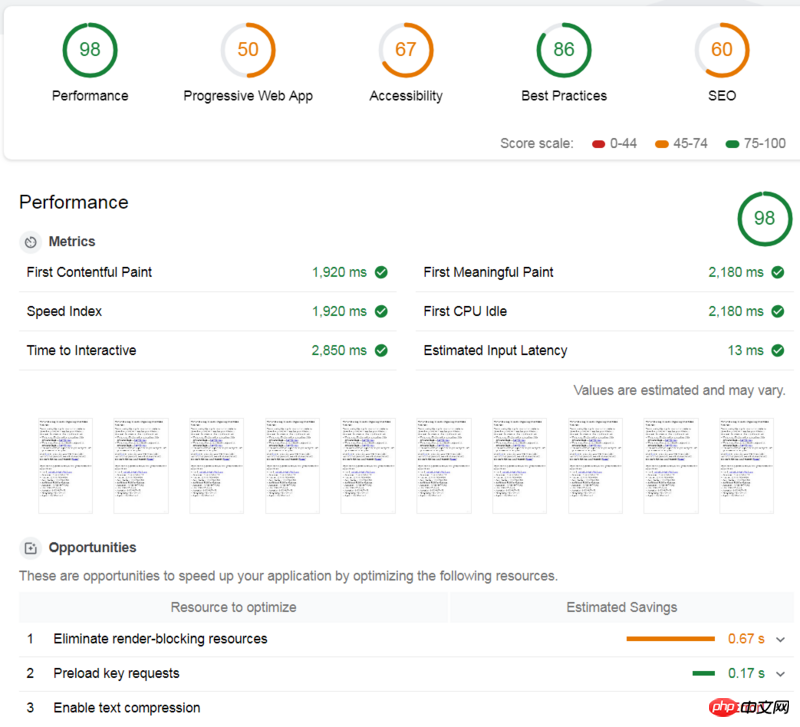
There are many ways to use Lighthouse. The simplest one is to use Chrome's developer tools. The steps are as follows:
Open Chrome browser
Press F12
Open the audits tab in the pop-up window
Click Perform an audit...check all
Run audit
npm install -g lighthouse
lighthouse
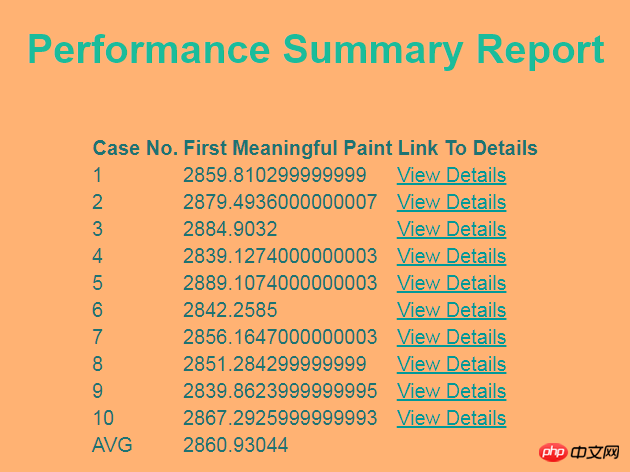
first-meaningful-paint milliseconds in the result indicator, and finally take the average of 10 times. For the sake of visualization and readability, the final results are displayed in the form of a web page, and users can view it on the web page. You can also see the average number of milliseconds to first-meaningful-paint after each execution of Lighthouse. If the user is interested in the details of a certain execution, he can click on the link to view it. The final result looks like this:


npm i lighthouse --save-dev
npm i chrome-launcher --save-dev
npm i fs-extra --save-dev
npm i gulp --save-dev
lighthouse-config.js in the project root directory. Here we all use the default configuration. To use the default configuration, you need to configure The file declares extends: 'lighthouse:default'.
module.exports = {
    extends: 'lighthouse:default'
}gulpfile.js, first introduce all dependent tools:
const gulp = require('gulp');
const lighthouse = require('lighthouse');
const chromeLauncher = require('chrome-launcher');
const printer = require('lighthouse/lighthouse-cli/printer');
const Reporter = require('lighthouse/lighthouse-core/report/report-generator');
const fs = require('fs-extra');
const config = require('.lighthouse-config.js');async function write(file, report) {
try {
await fs.outputFile(file, report);
} catch (Error e) {
console.log("error while writing report ", e);
}
}--headless means not opening the browser window.
async function launchChrome() {
    let chrome;
    try {
        chrome =  await chromeLauncher.launch({
          chromeFlags: [
            "--disable-gpu",
            "--no-sandbox",
            "--headless"
          ],
          enableExtensions: true,
          logLevel: "error"
        });
        console.log(chrome.port)
        return {
            port: chrome.port,
            chromeFlags: [
                "--headless"
            ],
            logLevel: "error"
         }
    } catch (e) {
        console.log("Error while launching Chrome ", e);
    }
}async function lighthouseRunner(opt) {
try {
return await lighthouse("https://www.baidu.com", opt, config);
} catch (e) {
console.log("Error while running lighthouse");
}
}Since we need to use the official Lighthouse template to generate the report, we call the official method. Note that the first parameter is passed in
result.lhr, and the second parameter is declared to generate an html report (you can also Generate reports in csv and other formats).
function genReport(result) {
    return Reporter.generateReport(result.lhr, 'html');
}start method returns first-meaningful-paint in the result (this is the indicator we are most concerned about. Readers can replace it according to their own needs. For specific indicators, please refer to Lighthouse).
async function run(timestamp, num) {
    let chromeOpt = await launchChrome();
    let result = await lighthouseRunner(chromeOpt);
    let report = genReport(result);
    await printer.write(report, 'html', `./cases/lighthouse-report@${timestamp}-${num}.html`);
    return result.lhr.audits['first-meaningful-paint'].rawValue;
    await chrome.kill();
}下面, 我们可以正式开始写一个 gulp task 啦,首先获得当前时间戳,用于最终生成的报告命名,然后声明一个数组,用于记录每次跑 Lighthouse 生成的 first-meaningful-paint 毫秒数,然后跑10次 Lighthouse, 使用提前创建的模板文件,根据这10的结果,生成一个汇总报告,这里,笔者使用了Lighthouse对外暴露的工具函数进行字符串的替换。
gulp.task('start', async function() {
  let timestamp = Date.now();
  let spent = [];
for(let i=0; i<p>最后的最后, 执行:</p><pre class="brush:php;toolbar:false">gulp start万事大吉。
附上汇总界面的模板源码:
nbsp;html>


  <meta>
  <meta>
  <title>Lighthouse Summary Report</title>
  <style>
    body {
      font-family: sans-serif;
    }
    table {
      margin: auto;
    }
    tr {
      border: 1px solid grey;
    }
    h1 {
       text-align: center;
       margin: 30px auto 50px auto
    }
  </style>
| Case No. | First Meaningful Paint | Link To Details |
|---|
以上就是本文的全部内容,希望对大家的学习有所帮助,更多相关内容请关注PHP中文网!
相关推荐:
jQuery+AJAX+PHP+MySQL开发搜索无跳转无刷新的功能
关于vue中extend,mixins,extends,components,install的操作
The above is the detailed content of How to use NodeJS + Lighthouse + Gulp to build an automated website performance testing tool. For more information, please follow other related articles on the PHP Chinese website!


