
In the last article, I introduced you to JavaScript development using DeviceOne (1) Configuration and start . This article will continue to introduce you to the relevant content about JavaScript practice. Let’s learn together.
Generate debugging installation package
First of all, it should be noted that this step is not necessary every time you debug the App. In most cases, the debugging installation package is generated once, and you can ignore this entire step after installing it on the phone. Because the debugging installation package contains many native components, all of which can be customized and selected. If you need to add some additional native components, you need to select more components and regenerate the debugging installation package.
Click the "Build Debug Version" button in the debugger menu. If you have not logged in, you will be prompted to log in

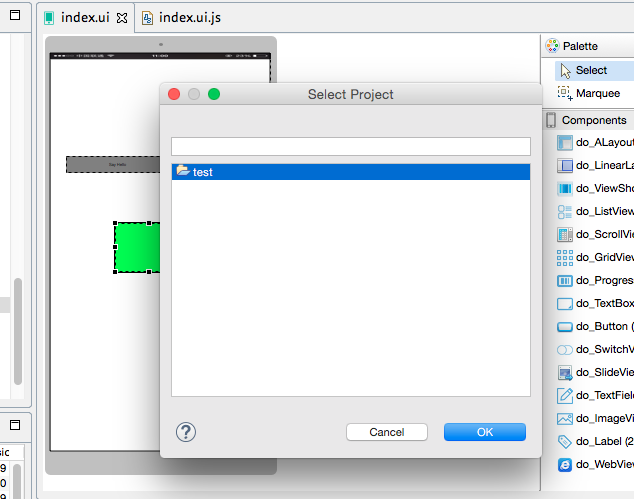
If you have multiple projects open, you need to select a specific project you want to package, and you need to be online when packaging.
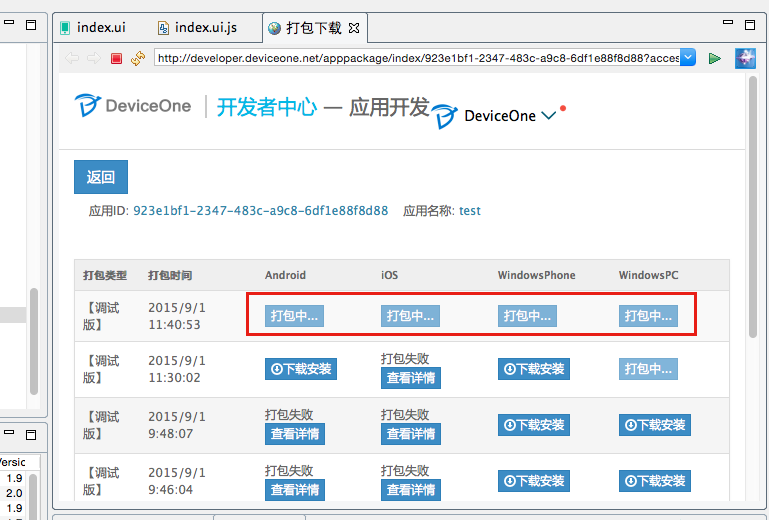
It only takes a few minutes, "Packaging..." will be completed and change to "Download and Install". After clicking, you can choose to install the QR code or download the file to your computer and install it on your phone through the tool.


Debugging and Development
After installing the installation package generated in the previous step on the mobile device (mobile phone or pad), the basic interface is as follows. The basic interface is the same for Android, IOS and Winphone. To debug, you need to right-click the "Create" button on "Service" in the designer, then click "Start" to start the service, record the displayed IP address and port number, and then enter the IP address into the "Service Address" of the debug version on the mobile phone. ”, please make sure that the IP of the mobile phone and the IP of the designer are in the same network segment, otherwise communication will not be possible. Finally, click the "Update" button


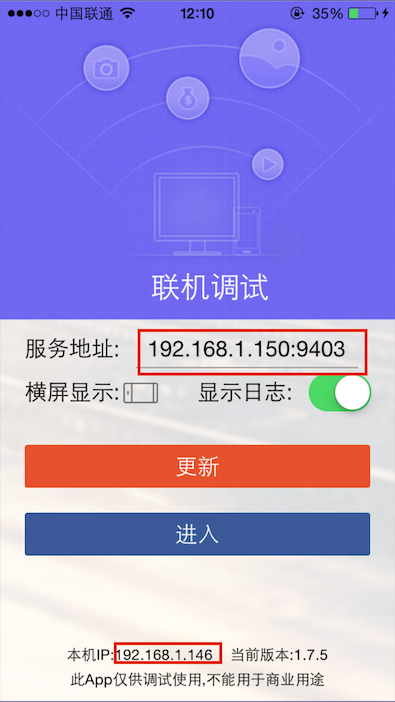
After the update is successful, click the "Enter" button to see the real effect of the App developed on the designer on the mobile phone. We can see that the effect is exactly the same as that seen on the designer, and we can see the green color label, you can also click the "Say Hello" button, and "Hello DeviceOne!!!" will pop up. In this way, we can continue to modify the code and UI on the designer, and then click the "Update" button and the "Enter" button again to see the development effect in real time. Until this App completes all the functions you need.
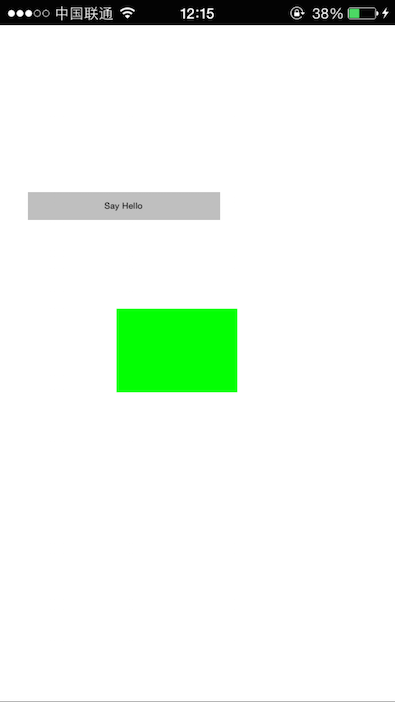
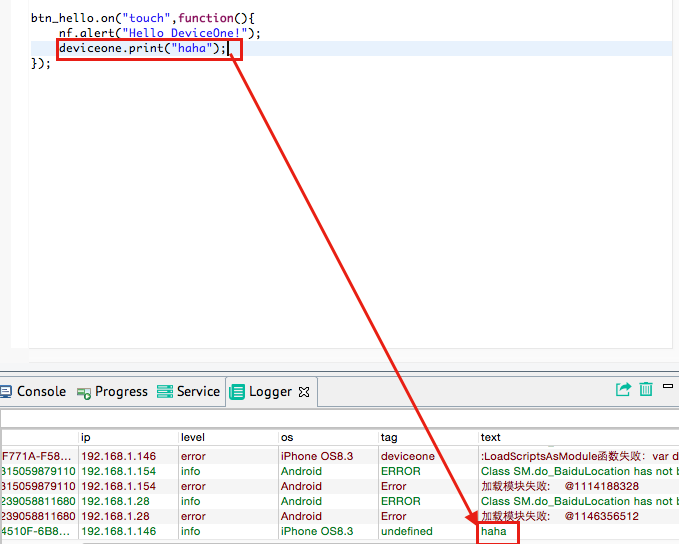
Single-step debugging is not supported yet. Currently, alert, toast mode debugging and deviceone.print debugging are supported. Among them, print debugging can display the printed data in the "Debug Log" of the designer in real time, but you need to ensure that the "Show Log" of the debugging terminal is checked.
Publish application
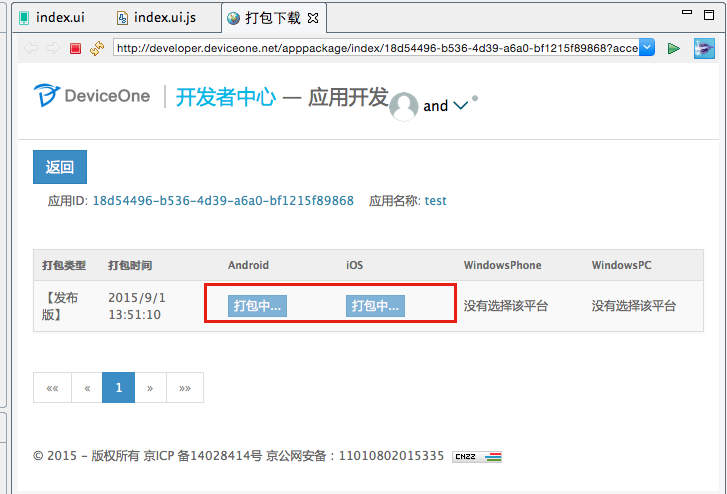
After the application is developed, the program can be packaged into a formal installation package through the cloud packaging service. It has its own icon, name, signature, etc. It can be uploaded to the official Appstore and can be downloaded and used by end users. Just click the "Build Single Version" button in the designer, and finally download the installation package on the download page.

To Be Continue.....


