


This article mainly introduces the method of using Jpgraph to draw simple X-Y coordinate diagrams in PHP, and analyzes the related techniques of Jpgraph to draw coordinate diagrams and curves with examples. I hope to be helpful.
The specific implementation method is as follows:
<?php
include ("src/jpgraph.php");
include ("src/jpgraph_line.php");
//将要用于图表创建的数据存放在数组中
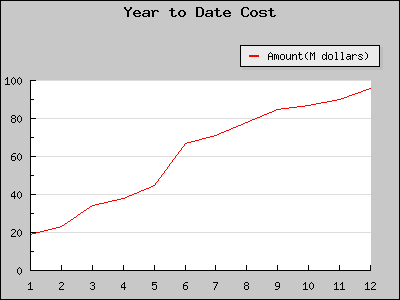
$data = array(19,23,34,38,45,67,71,78,85,87,90,96);
$graph = new Graph(400,300); //创建新的Graph对象
$graph->SetScale("textlin"); //设置刻度样式
$graph->img->SetMargin(30,30,80,30); //设置图表边界
$graph->title->Set("Year to Date Cost"); //设置图表标题
// Create the linear plot
$lineplot=new LinePlot($data); // 创建新的LinePlot对象
$lineplot->SetLegend("Amount(M dollars)"); //设置图例文字
$lineplot->SetColor("red"); // 设置曲线的颜色
// Add the plot to the graph
$graph->Add($lineplot); //在统计图上绘制曲线
// Display the graph
$graph->Stroke(); //输出图像
?>
Related recommendations:
PHP graphics operation Jpgraph
php report jpgraph histogram example code
Jpgraph class library introductionntgraph graph download pyqtgrap
The above is the detailed content of PHP uses Jpgraph to draw the basics of coordinate charts. For more information, please follow other related articles on the PHP Chinese website!


![[Web front-end] Node.js quick start](https://img.php.cn/upload/course/000/000/067/662b5d34ba7c0227.png)


