
First, let’s introduce the development history of Yunwen Technology.

Yunwen Technology Company...
2023 is the period when large models are prevalent , many companies believe that the importance of maps has been greatly reduced after large-scale models, and the preset information systems studied before are no longer important. However, with the promotion of RAG and the prevalence of data governance, we have found that more efficient data governance and high-quality data are important prerequisites for improving the effectiveness of privatized large models. Therefore, more and more companies are beginning to pay attention to knowledge construction related content. This also promotes the construction and processing of knowledge to a higher level, where there are many techniques and methods that can be explored. It can be seen that the emergence of a new technology does not defeat all old technologies. It is also possible that better results will be achieved by integrating new and old technologies. We must stand on the shoulders of giants and keep expanding.
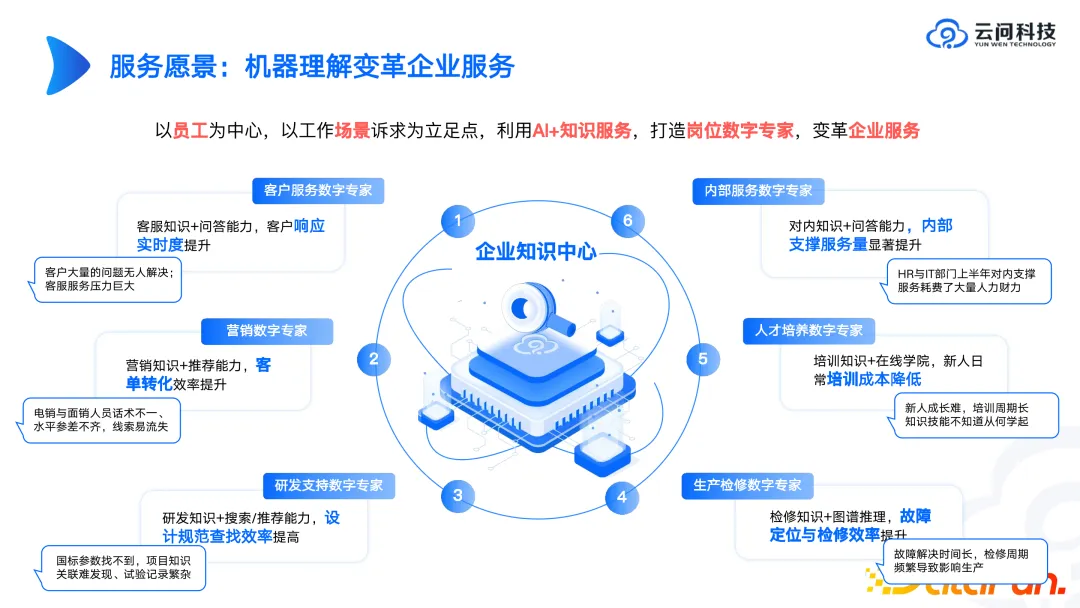
Why does Yunwen Technology focus on the enterprise knowledge center? Because we have found in some cases in the past that when faced with many complex scenarios, such as risk control, drug testing, etc., it is difficult to achieve ideal results in the short term by directly letting large models do these complex tasks, and it is difficult to create a Standardized products are delivered. In enterprise knowledge management or office-related business management scenarios, trial operation can be entered relatively quickly, and ideal results may be obtained. Therefore, when we work with enterprises to create large-scale privatization models this year, we will include enterprise knowledge management, including question and answer or search based on enterprise knowledge management, as a key topic. For enterprises, the construction of their own privatized knowledge and knowledge centers is very important.
Based on these reasons, if there are friends who want to study the direction of knowledge graph, our suggestion is to consider the whole life cycle of knowledge, think about the problems to be solved and the specific landing place. . For example, some companies use existing documents to generate content related to exams, training, and interviews. Although these technical hot words are so hot, such a privatization model will be more effective than GPT3.5 or GPT4, because in this scenario Some scene pre-production has gone through. Therefore, we believe that more specialized and sophisticated models will be a major trend in future development.
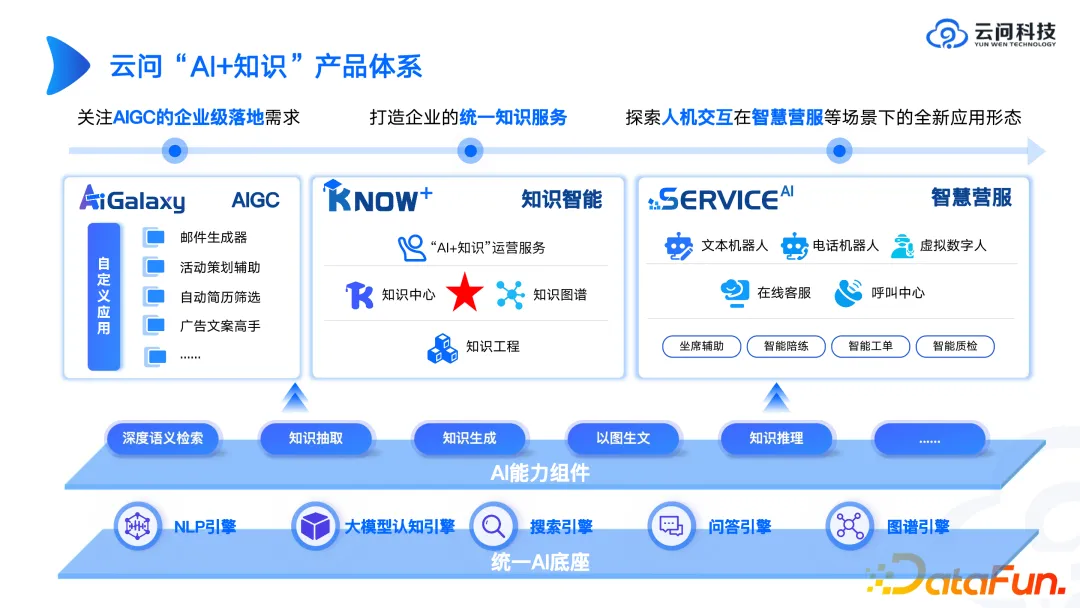
Under the above background, what will the form of the map product look like? Next, we will introduce the "AI + knowledge" product system of Yunwen Technology as an example.
First of all, there must be a unified AI base. This cannot be done by one team or even one company. You can use third-party APIs or SDKs of large model engines. In many cases, it is not necessary to build a wheel from scratch, because it is likely that the wheel that took several months to build will not be as effective as an open source model that has just been released. Therefore, for the AI base part, it is recommended to think more about how to combine third-party technologies. If you develop it yourself, you must think clearly about the advantages. Of course, it is best to give full play to the value of the platform and take into account both.
Regarding AI capability components, from some of our delivery experiences we have found that these AI capability components tend to sell better than products. Because many companies hope to use components built by professional technology companies to build their own upper-layer applications. In the era of big models, selling AI capability components is like selling shovels, and the gold mines are still mined by large companies themselves.
In terms of upper-layer applications, we will implement it from the three directions of AIGC's own application, knowledge intelligence and intelligent business services. Explore in which direction there would be greater value. The knowledge graph is classified by us as a core link in the entire knowledge intelligence. It should be noted that the knowledge graph is the core but not the only one. We have encountered many scenarios before. Customers have a large number of relational databases and a large number of unstructured documents. We hope that we can incorporate all these knowledge systems and knowledge assets into the knowledge graph. The cost of doing so is very high. We believe that the future knowledge architecture should be heterogeneous. Some knowledge is in documents, some knowledge is in relational databases, and some knowledge may come from graph networks. In the end, what large models need to do is to be based on multi-source heterogeneous Comprehensive analysis of structural data. For example, for an intelligence piece, you can extract some numerical indicators from a relational database, find some suggestions in documents, search for some historical information from work orders, and then put all the content together for analysis. This is how we think of a combination of large models and knowledge graphs. In an overall architecture, the large model does the final analysis, and the knowledge graph helps the large model find the knowledge hidden behind it more quickly and accurately through its knowledge representation system.
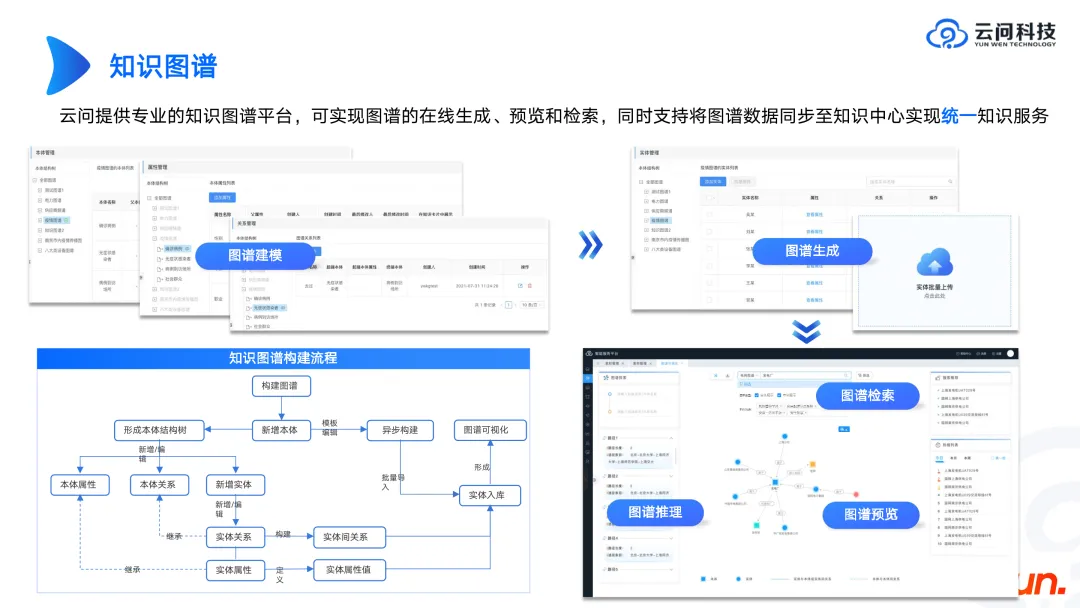
We have discussed the relationship between the large model and the map before. Next, let’s review what the map itself needs.
First of all, behind the graph is a graph database, such as open source Neo4j, Genius Graph, and some domestic database brands. Knowledge graph and graph database are two different concepts. Creating a knowledge graph product is equivalent to encapsulating the upper layer of the graph database to achieve rapid graph modeling and visualization.
When you want to create a knowledge graph product, you can first refer to the product form of Neo4j or the knowledge graph products of some major domestic manufacturers, so that you can roughly understand what functions and functions the knowledge graph product needs to implement. link. What's more important is to know how to build a knowledge graph. This seems to be a business problem, because different companies and different scenarios have different graphs. As a technician, if you don't understand electricity, equipment, industry, etc., it is impossible to build a map that satisfies the business. It requires continuous communication with the business and continuous iteration to finally get a result. The discussion process can actually return to the essence of schema, and present a set of ontology theories and logical concepts of the schema. These contents are very important. Once the schema is finalized, more relevant personnel can be involved to enrich the content and further improve the product. Here are some of our experiences so far.
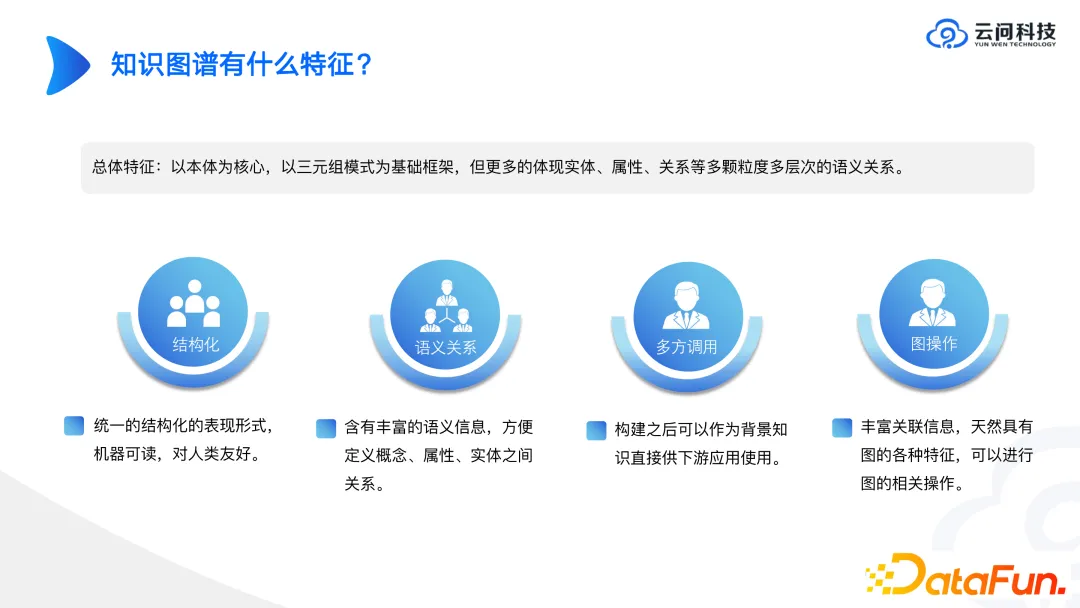
The following introduces the overall characteristics of the map. At present, knowledge graphs are still mainly based on triples, on which multi-granularity and multi-level semantic relationships such as entities, attributes, and relationships are constructed. In the industrial world, we often encounter problems that cannot be solved by triples. When we use set entity attribute values to describe the real physical world, many problems will arise. At this time, we will implement the constrained conditions in the form of CVT. Therefore, when building a knowledge graph, everyone must first demonstrate that triples can solve the current problem.
One thing that needs to be pointed out is that when building a map, it must be built as needed, because the world is infinite and the knowledge content in it is also infinite. At the beginning, we often have a vision of portraying all entities that exist in the physical world into our computer world. The problem with this is that the entire schema built in the end is too complex and is not helpful for real business. For example, the fact that the earth revolves around the sun, I can construct it in a triple. But this triplet can't solve the actual problem I'm facing now, so I must build the triplet as needed.
So how to deal with common sense problems? Many questions do require common sense triples. We think this can be left to large models. We also hope that the knowledge graph can explore professionalism and build truly relevant knowledge into the graph. Then the large model can be based on common sense and combined with prior knowledge provided by the knowledge graph that cannot be obtained in the open field to achieve better results.

The construction of the knowledge graph requires business personnel and operation personnel to jointly design it, including the definition of ontology, relationships, attributes and entities, and how to visualize it. In the end, it will involve a question, which is what content to present to users in terms of product form. If the user is the final consumer, then only visual search and Q&A need to be presented. Because this type of customer does not care how the map is constructed, whether it is automated or manual.
Another very important issue involved here is that even in large model scenarios, not all maps can be automatically constructed. The cost of constructing a graph is very high. Instead of spending a lot of energy on graph modeling, we should spend our energy on consumption. If you want to achieve business acceptance, you may have to rely on manual construction. For example, if a table with a certain format is complex across tables, we can try to find a baseline using a large model. This shifts energy from building to consuming. For example, if a project cycle lasts for 100 days, we spend 70 days building the map, and spend the last 30 days thinking about the application scenarios of this map. Or because the early construction time is extended, there is no time to think about valuable consumption scenarios, which may lead to Big question comes. In our experience, you should spend a small amount of time building, or default to manual building. Then spend a lot of time thinking about how to maximize the value of the constructed map.

#The above figure shows the process of building a knowledge graph. When building the ontology, we must accept that the ontology changes, just like the table structure of the database itself may also be updated. Therefore, when designing, be sure to consider its robustness and scalability. For example, when we are making a map of a certain type of equipment, we should consider the entire equipment system. In the future, you may need to search for devices through this system, and you should also understand that other devices under this system have not yet built maps, which can be built in the future. Bring greater value to users through the entire large system.
A question we often hear is, I can find the answer through the FAQ or the large model, why should I use a map? Our answer is that if we associate the current knowledge with the map, the world we see is no longer one-dimensional, but a networked world. This is a value that the map can realize on the consumer side, and It is difficult to achieve with other technologies. At present, everyone's focus is often on the magnitude and what advanced algorithms are used, but in fact, we should think about the construction of the graph from the perspective of consumption and problem solving.

At a time when large models are prevalent, we need to consider the combination of large models and graphs. It can be considered that the graph is the upper-layer application, while the large model is the underlying capability. We can understand what help the large model brings to the map from different scenarios.
When constructing the graph, information extraction can be performed through some documents and prompt words to replace the original UIE, NER and other related technologies, thereby further improving the extraction capability. We should also consider whether a large model or a small model is better in the case of zero-shot, few-shot and sufficient data training. There is no single answer to this kind of question, and there are different solutions for different scenarios and different data sets. This is a brand new path of knowledge construction. At present, in zero-shot scenarios, large models have better extraction capabilities. However, once the sample size increases, the small model has more advantages in terms of cost performance and inference speed.
On the consumer side, using graphs to solve reasoning problems, such as policy judgments, such as judging whether an enterprise can meet a certain policy and whether it can enjoy the benefits mentioned in the policy Welfare. The previous approach was to make judgments through graphs, rules and statement expressions. The current approach is just like Graph RAG, which uses user questions to find triples or tuples similar to the current enterprise, and uses large models to obtain answers and draw conclusions. Therefore, many graph reasoning problems and graph construction problems can be solved through large model technology.
Regarding the problem of graph storage, the data structure of the graph database and the graph itself is very important. Large models cannot handle long text or the entire graph in the short term, so the storage of the graph is a Very important direction. Like the vector database, it will become a very important component in the future large model ecosystem. The upper-layer application will decide whether to use this component to solve the actual problem.

Graph visualization is a front-end problem and needs to be designed according to the scenario and the problem to be solved. We also hope that the technology can be used as a middle platform to provide certain capabilities to meet different interaction forms in the future, such as mobile terminals, PCs, handheld devices, etc. We only need to provide a structure, and how the front end renders and presents can be determined based on actual needs. Large models would also be a way to invoke such structures. When the large model or agent can determine how to call the graph based on requirements, the closed loop can be opened. Graph needs to be able to encapsulate better APIs to adapt to calls from various applications in the future. The concept of middle platform is gradually being taken seriously. An independent and decoupled service can be more widely used by all parties.
For example, sometimes you need to find a certain value left in a table in the document. It is difficult to locate its location through search or large model technology. If you use the structure of the map With the ability to present content, you can obtain the value of this map by calling an interface in the application system, and present the document where it is located, or the analysis results of the large model. This visualization method is the most efficient for users. This is also the currently popular Copilot method, which is to jointly solve problems by calling map, search or other application capabilities, and finally use large models to generate the "last mile" to improve efficiency.
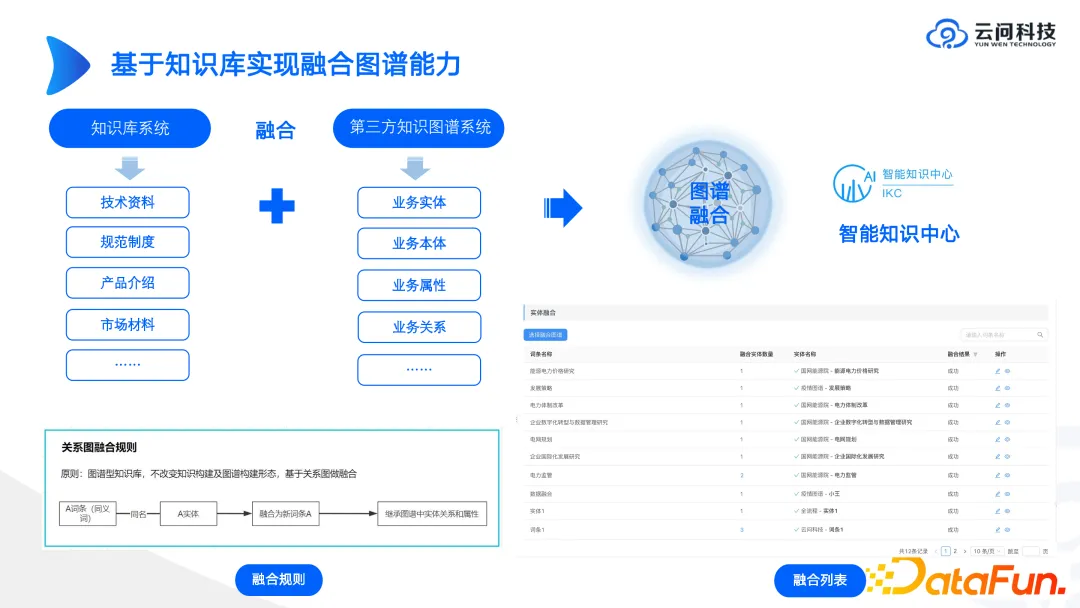
Nowadays we often do various integrations of knowledge bases and graphs. There are many knowledge projects emerging this year. Previously, knowledge was primarily available for search and consumption. With the emergence of large models, everyone discovered that knowledge can also be supplied to large models for consumption. Therefore, everyone pays more attention to the contribution and construction of knowledge. We have a lot of knowledge ourselves, and we also need a third-party knowledge graph system because our knowledge is unstructured, and there will be a lot of very important knowledge, such as work orders, equipment maintenance cases, etc., and we need to transfer this knowledge to Structured content is stored. This content was previously used for search, but now it can be used for SFT on large models.
Knowledge base and graph are inherently combinable. When combined, a set of knowledge service products can be provided to the outside world in a unified manner. The vitality of this knowledge service product is very strong, and there will be a demand for knowledge whether in OA, ERP, MIS, or PRM systems.
When integrating, we must pay great attention to how to distinguish knowledge and data. Customers provide large amounts of data, but this data may not be knowledge. We need to define knowledge from the demand side. For example, for a piece of equipment, we usually need to know what content, such as data fluctuations when the equipment is running, these are data, and the equipment's factory time, last maintenance time, etc., these are knowledge. How to define knowledge is very important and needs to be jointly constructed with the participation and guidance of the business.

In the process of digital transformation, AI and graph technologies will be used in scenarios such as scheduling, equipment, marketing, and analysis. Especially in the dispatching scenario, whether it is traffic dispatching, energy dispatching or manpower dispatching, it is all carried out in the form of task distribution. For example, if there is a fire, how many people, vehicles, etc. need to be dispatched? Some relevant data needs to be queried when scheduling. The current problem is often not that no results can be found, but that too much content is returned, but no truly useful information can be given. solution. Because the consumption of knowledge still remains in keyword search, all documents containing the word "fire" will be displayed. For a better presentation, you can use the graph. For example, when designing the ontology of "fire", its upper ontology is disaster. For the entity of "fire", you can design its precautions, protective measures and experience cases. Split knowledge through these contents. In this way, when the user enters "fire", a relevant map context and what should be done next will be presented.
In scheduling-related scenarios, attention should be paid to the direction of Agent. Agent is very important for scheduling because scheduling itself is a multi-tasking scenario. The results returned by the map will be more accurate and richer.
There are also many application scenarios for smart devices. Equipment information will be stored in different systems. For example, factory information is stored in product manuals, maintenance information is stored in maintenance work orders, operating status is stored in the equipment management system, and inspection status is stored in the industrial inspection system. . A big problem faced by industry is that there are too many systems. If you want to query the information of a device, you need to query it from multiple systems, and the data in these systems are not connected to each other. At this time, a system is needed that can open up the connection and associate and map all content. A knowledge base with knowledge graph as its core can solve this problem.
The knowledge graph can include its related attributes, fields, field sources, etc. through the ontology, and can describe and associate the series and parallel relationships between various systems from the bottom. But when building your graph, keep in mind that you need to design and build your graph accordingly. When many companies build a map, they will transfer all the data from the data center through D2R technology. This map actually has no meaning. When building a map, you must consider the relationship between the dynamic map and the static map.
There are also many application scenarios and design techniques in the fields of intelligent marketing and multi-scenario energy AI, which will not be discussed here and can be discussed later.

When building a graph, architectural design is very important. How to integrate underlying libraries and processes with graph construction and consumption. There are a lot of details to think about in how it is ultimately delivered. You can refer to the links listed in the figure above for design and practice.
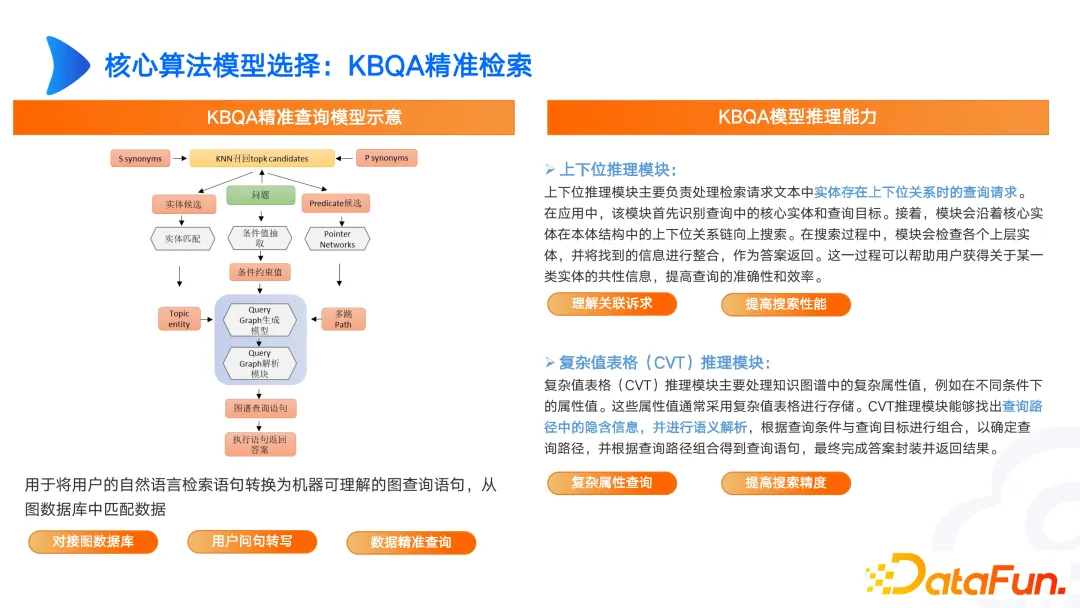
We have also done some research in graph KBQA, such as upper and lower bits, graph CVT query, etc. For example, in medical scenarios, fever and headaches are associated with abnormal body representations. Fever or headaches are not stored separately in the knowledge base. In the original documents, they are stored as minor physical abnormalities. When there are differences between user representations and professional representations, we can solve it through superior and inferior reasoning CVT.
The currently built graph may only be SPO or multi-hop or TransE entity alignment. However, in actual complex scenarios, CVT needs to be implemented in combination with upper and lower positions. There are also many papers that perform very well on English data sets, but the results on Chinese data sets are not ideal. Therefore, we need to design based on our own needs and continuously iterate to achieve good results.
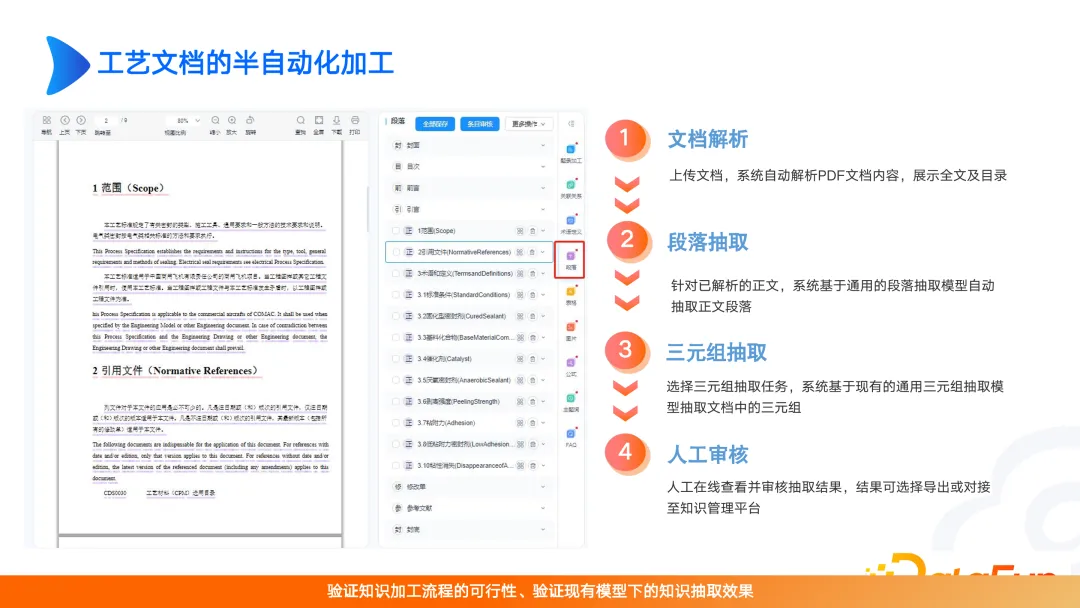
Semi-automatic document processing, including document parsing, paragraph extraction, triple extraction and manual review. This step of manual review is often ignored, especially after the arrival of large models, people pay less attention to manual review. In fact, if data processing and data governance are performed, the model effect will be greatly improved. Therefore, we must consider that the scenario we ultimately want to solve must have high value, and we must also pay attention to where the resources are invested, whether it is in the construction of the map or the optimization of large models. Without these considerations, the product will be easily replaced or challenged.

The picture above shows a device life cycle management product of Yunwen Technology. Such scenarios are realized through lightweight intermediate modules and upper-layer application construction in different scenarios. The vitality of these modules is far more vigorous than the vitality of the knowledge graph system itself. Selling standalone or middleware only is not suitable in the graph field, especially in industrial scenarios. Many industrial problems are very complex from the customer's perspective and cannot be solved by diagrams or large models. What we need to do is to convince customers from the effect.
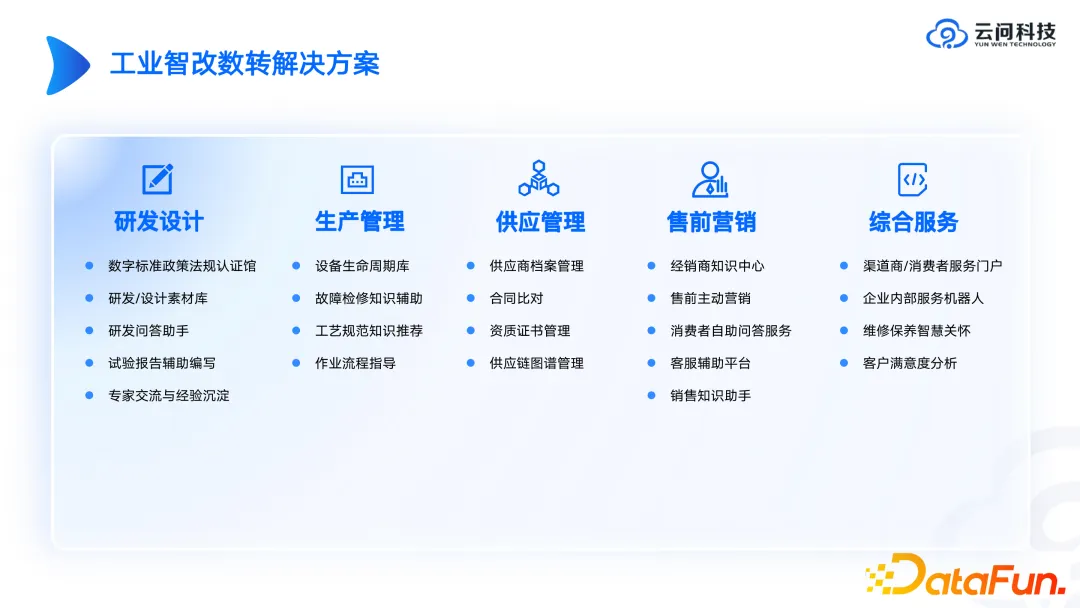
In the process of industrial intelligent transformation, there are many applications in R&D and design, production management, supply management, pre-sales marketing and comprehensive services point.

The above picture is an example of the application scenario of fault equipment map. In this scenario we did not include all graph elements, such as equipment operating status and simple data in a relational database. We believe that for equipment maintenance, we mainly focus on three types of data. The first type is the basic information of the equipment, such as the time of leaving the factory, the manufacturer, and how long it has been in operation; the second type is faults, such as the name of the fault, superior and subordinate, such faults What defects will cause, what types of faults will cause what kind of faults, etc.; the third category is work orders, which describe what faults occurred on what equipment. By connecting these three types of data, we can construct a small closed-loop graph. In the future, it can also be extended based on dynamic data. Therefore, when building a graph, we prefer to make a small, beautiful graph with a closed-loop scene. It is not a map that only pursues high-end products, but cannot meet the needs of consumers.
Therefore, when building an industrial knowledge graph, we must start from specific scenarios and build the graph by analyzing the scenario requirements to achieve better implementation and application.
The above is the detailed content of Advanced practice of industrial knowledge graph. For more information, please follow other related articles on the PHP Chinese website!


