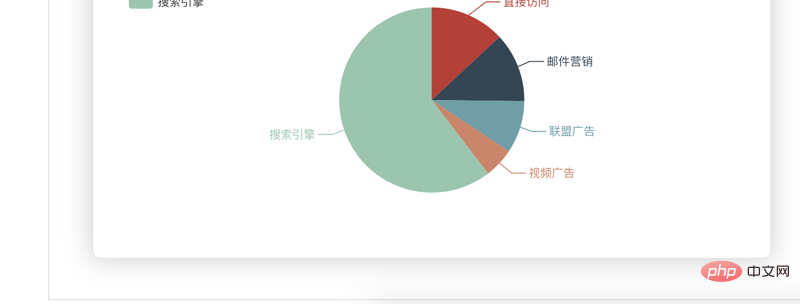
vue.js能用echarts,具體操作方法:1、在控制台中輸入「npm install echarts --save」指令安裝echarts依賴;2、在main.js中進行全域引入,就可以使用echarts創建圖表。

本教學操作環境:windows7系統、vue2.9版本,此方法適用於所有品牌電腦。
相關推薦:《vue.js教學》
最近工作中需要用到echarts,由於專案是用的vue-cli開發的。在網路上搜到vue中合成了vue-echarts,但是不想使用vue中規定好的資料格式,於是就自己做了一個vue專案引用原生echarts的簡單demo,實作過程如下:用了兩種實作方式
準備工作
1、安裝echarts依賴
控制台輸入:npm install echarts --save
#2、全域引入
main.js中引入
import echarts from 'echarts' Vue.prototype.$echarts = echarts
建立圖表
##第一種建立方式 在一個.vue檔案中引入多張圖表 建立WelcomePage.vue第一种在vue中使用echart的方式
{{ msg }}
第二种方式:通过组件的方式进行页面渲染
{{ msg }}
{{ msg }}

import WelcomePage from '@/components/WelcomePage' import Father from '@/components/father' import BarGraph from '@/components/bargraph' import PieGraph from '@/components/piegraph' export default new Router({ routes: [ { path: '/', name: 'WelcomePage', component: WelcomePage }, { path: '/father', name: 'father', component: Father, children:[ { path: '/bargraph', name: 'bargraph', component: BarGraph }, { path: '/piegraph', name: 'piegraph', component: PieGraph } ] }, ] })
程式教學! !
以上是vue.js能用echarts麼的詳細內容。更多資訊請關注PHP中文網其他相關文章!


