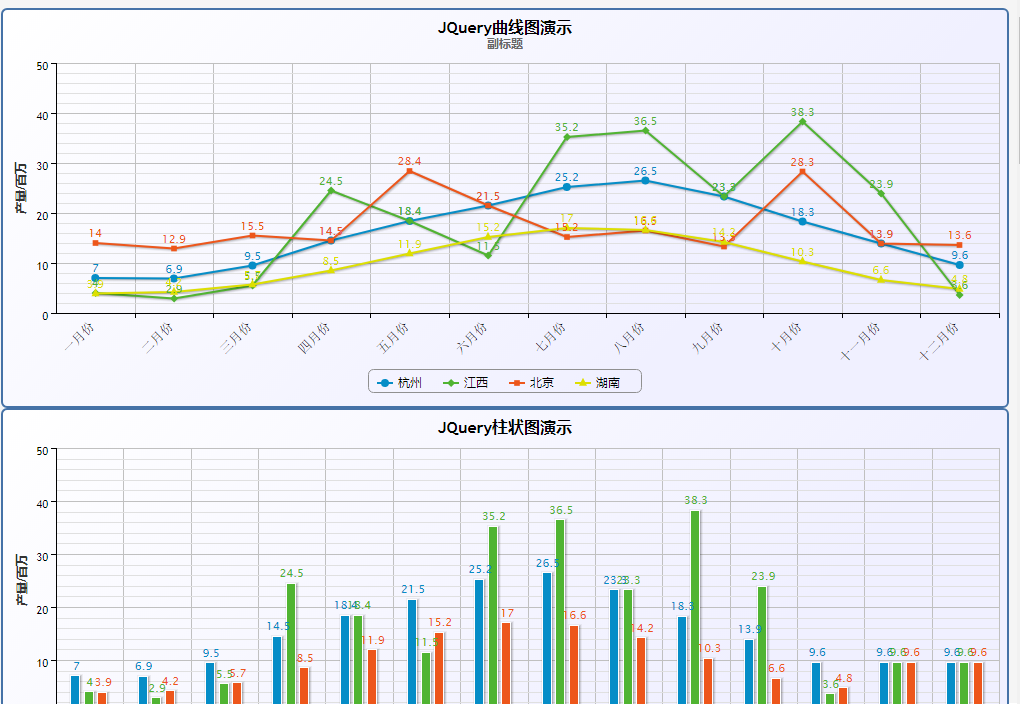
Bar chart, line chart, pie chart and other chart plug-ins
Chart plug-ins such as bar charts, line charts, pie charts, etc.
All resources on this site are contributed by netizens or reprinted by major download sites. Please check the integrity of the software yourself! All resources on this site are for learning reference only. Please do not use them for commercial purposes. Otherwise, you will be responsible for all consequences! If there is any infringement, please contact us to delete it. Contact information: admin@php.cn
Related Article
 FusionCharts 2D bar chart and line chart combination chart
15 Feb 2017
(1) Understand the characteristics and usage of combination charts, and choose the type of chart; (2) Design two columns and two polylines and display them separately.
 How to put line chart and bar chart together in excel Tutorial on merging line chart and bar chart in excel
03 Sep 2024
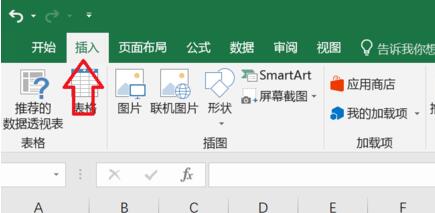
Sometimes when we import data through excel tables, in order to make better comparisons, many users will use line charts and column charts, but they are displayed separately, and the comparison effect is not so obvious, so many small My partner wants to combine these two pictures together. In order to facilitate everyone's operation, this software tutorial will share the specific solutions with the majority of users. Users in need can come to the PHP Chinese website to view the complete operation steps. How to put line chart and column chart together in Excel: 1. First enter the top insertion toolbar. 2. Then select all the data to generate a chart and click the Chart button. (At least 2 types of data are required) 3. After clicking, a data chart will be automatically generated. 4. After generation, right-click the chart and select Update
 FusionCharts 2D bar chart and line chart combination chart debugging error
15 Feb 2017
When designing the combination chart of FusionCharts 2D bar chart and line chart, I found that no matter how I restarted the server, the combination chart would not appear.
 How to use the combination of bar chart and line chart
24 Jul 2019
Steps for combining bar charts and line charts: 1. Preliminarily generate a combination chart. 2. Set the vertical axis data and fill the column color. 3. Set the polyline format. 4. Add and set data labels. . 5. Set the vertical coordinate title and adjust the text direction. 6. Adjust chart format and layout.
 Selection and comparison of Vue statistical chart plug-ins
17 Aug 2023
Selection and comparison of Vue statistical chart plug-ins With the increasing demand for data visualization, statistical chart plug-ins have become an indispensable part of development. For projects developed using the Vue framework, it is very important to choose a suitable Vue statistical chart plug-in. This article will introduce some common Vue statistical chart plug-ins and compare them to help developers choose the appropriate plug-in. vue-chartjsvue-chartjs is a Vue plug-in based on Chart.js, which provides a simple
 JFreeChart chart generation examples (pie charts, bar charts, line charts, time series charts)
10 Nov 2016
JFreeChart chart generation examples (pie charts, bar charts, line charts, time series charts)
24 Jun 2016
Who can give me an example of using java to implement a bar chart and a pie chart? Linked to the database. Also, I don’t know how to display it on the jsp page.
 What are the ways to submit forms in JavaScript?
28 Feb 2019
There are three ways to submit form forms in JavaScript: form submission directly through the submit button, form submission through the button button triggering the onclick event, and form submission through the submit button triggering the onsubmit event.
 Sample code sharing for implementing Material Design using CSS3
26 May 2017
Continuously updating preview {code...} Button Button Initial button {code...} Stroke button {code...} Disable button {code...} Float button {code...} Button group {code. ..} Form Form Text input {code...} Switch {code...} Single selection {code...} Multiple selection {code...


Hot Tools

Frosted glass effect form login interface
A very atmospheric frosted glass effect form login interface

HTML5 cool button particle animation effects
A cool HTML5 button animation that can be used to create burst particle animations
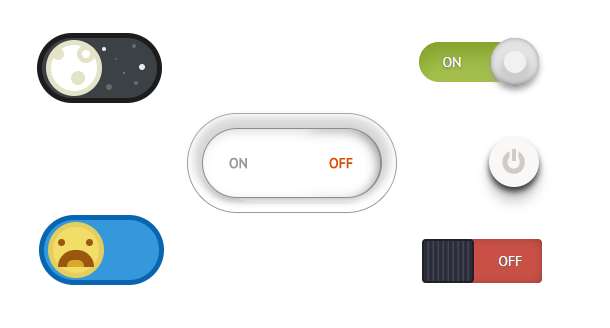
Multiple sets of creative CSS3 switch button codes
Pure css3 to create creative switch button switching.
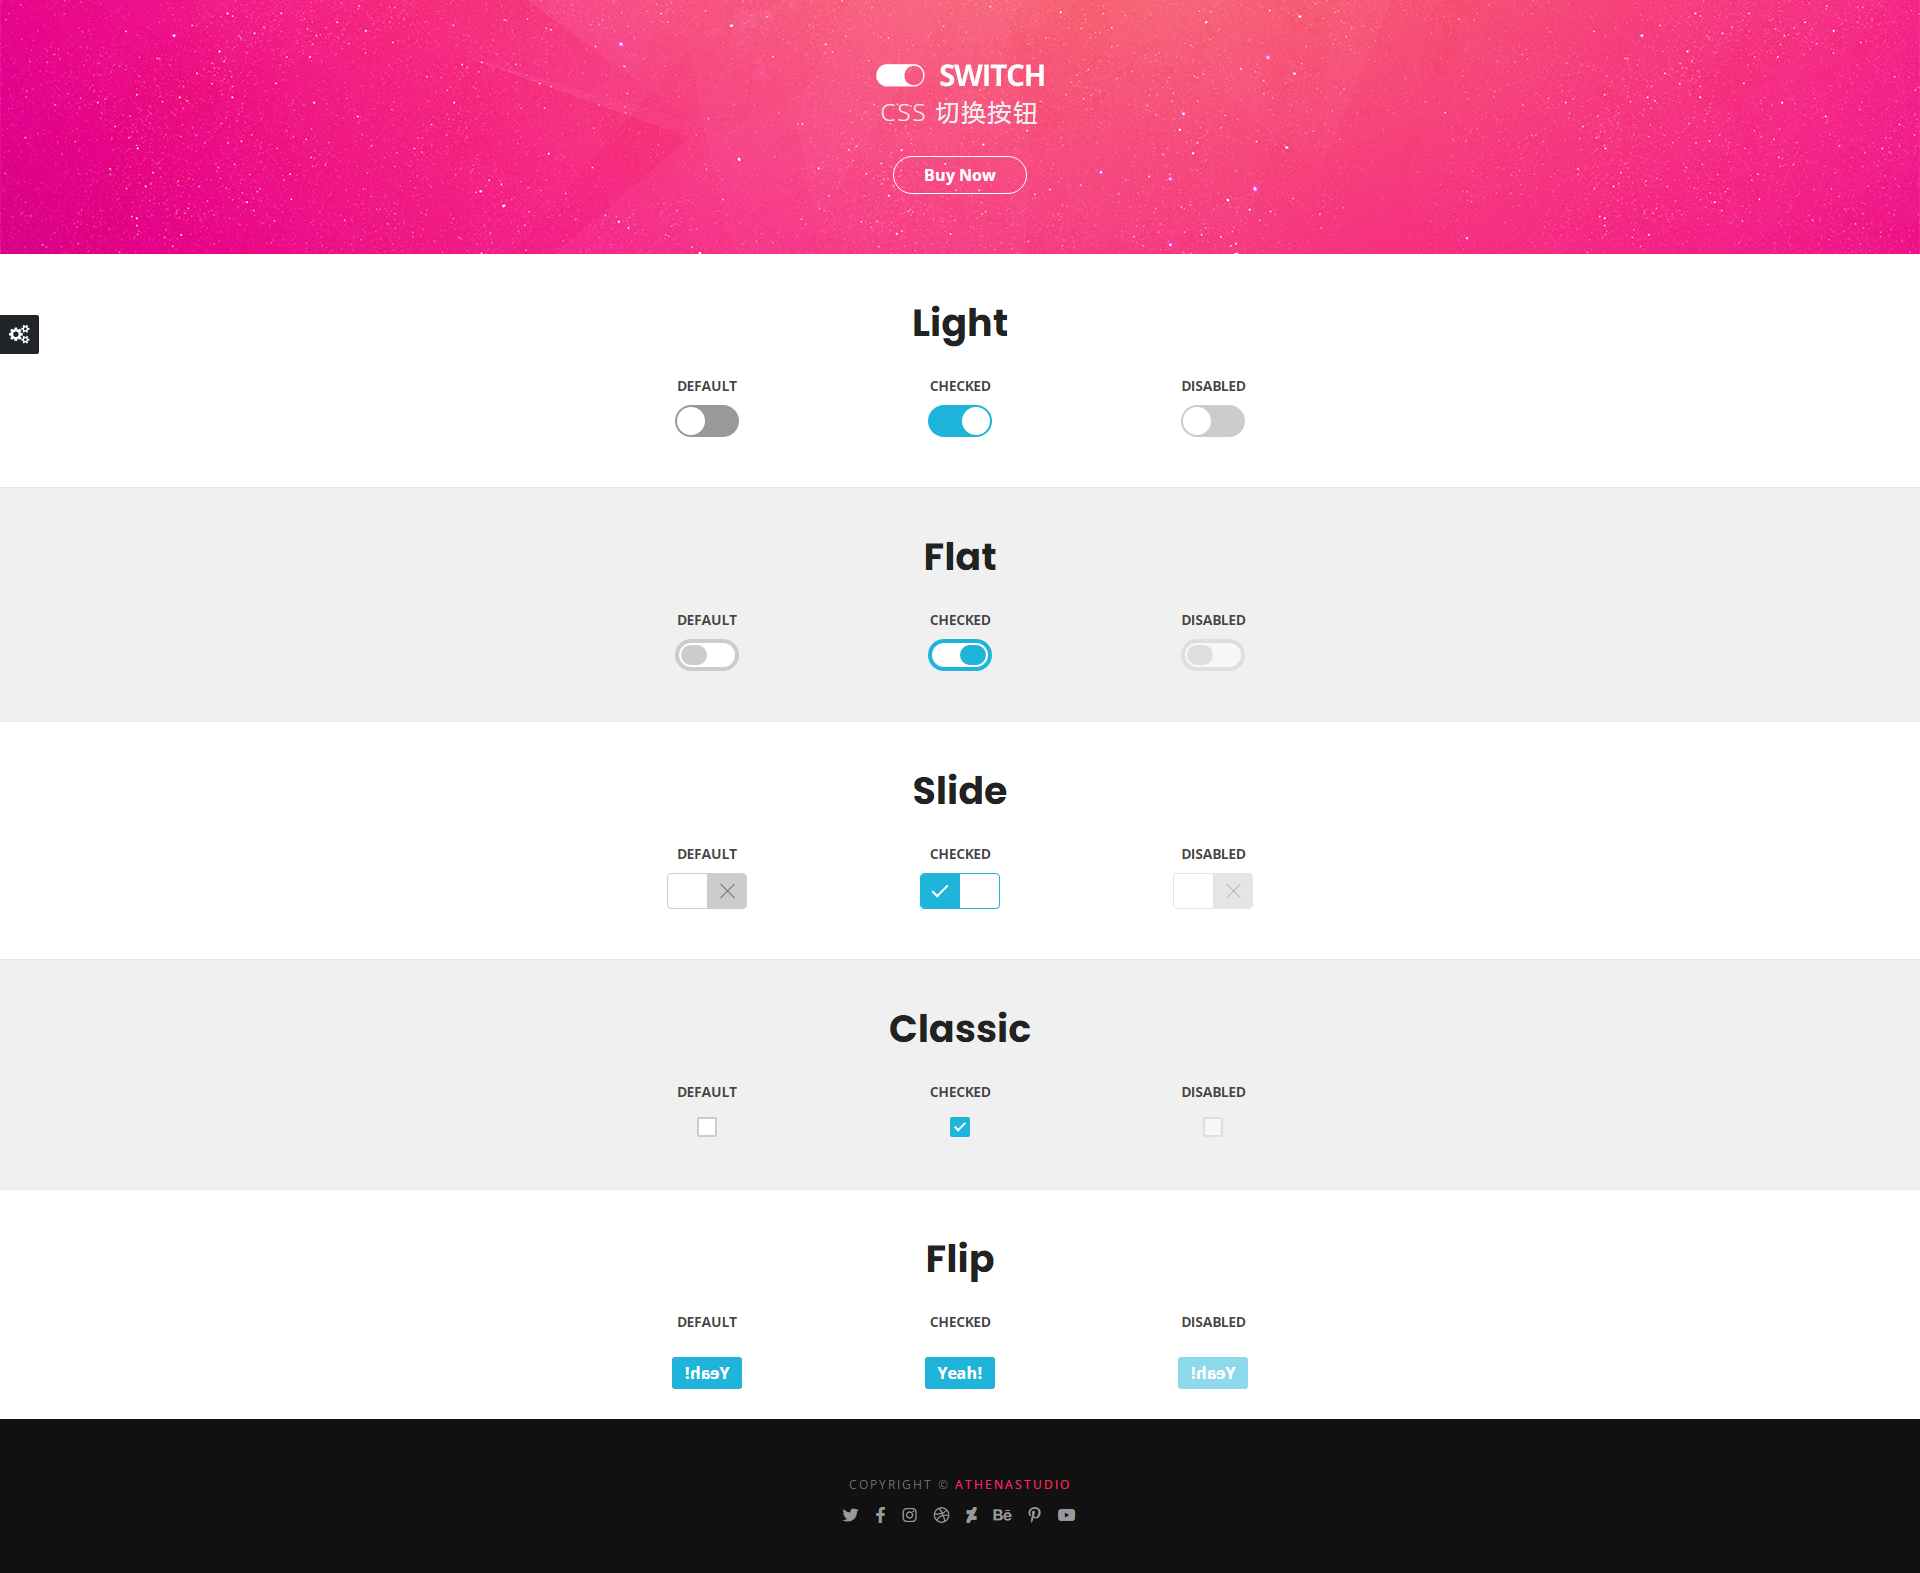
5 classic switching button interaction effects
5 classic switching button interactive effect designs
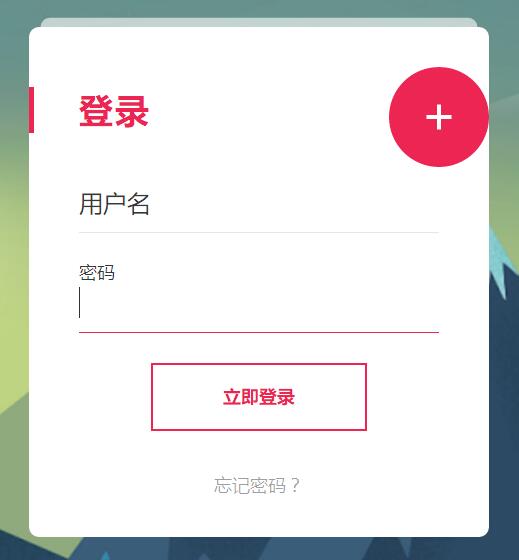
Registration login interface js special effects cool switching code
Registration login interface js special effects cool switching code.


