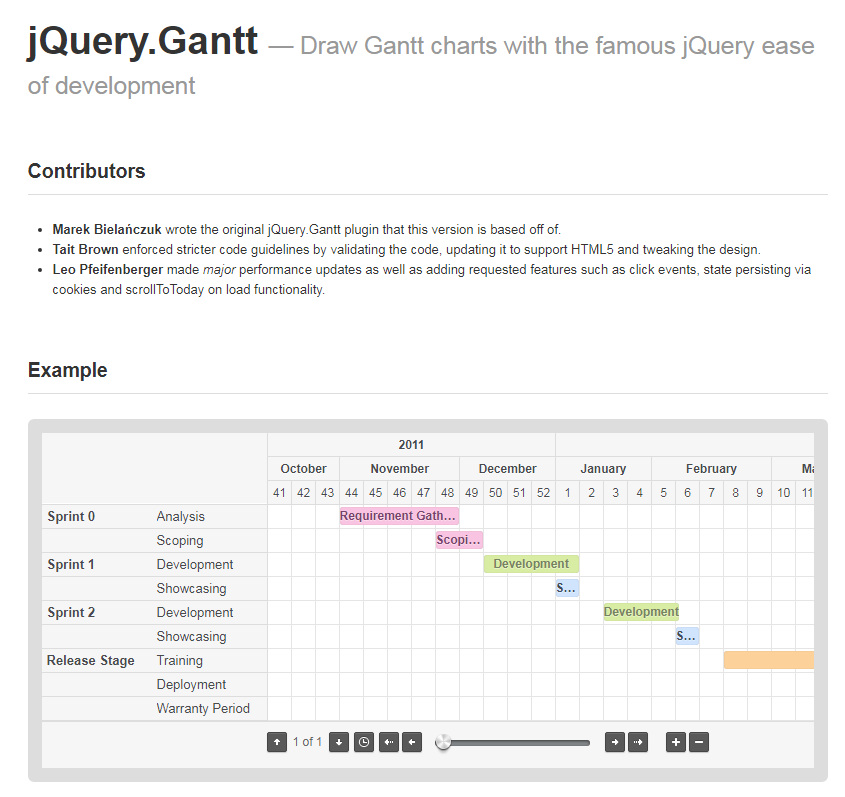
Gantt chart plug-in jQuery.Gantt
JQUERY’s Gantt chart
All resources on this site are contributed by netizens or reprinted by major download sites. Please check the integrity of the software yourself! All resources on this site are for learning reference only. Please do not use them for commercial purposes. Otherwise, you will be responsible for all consequences! If there is any infringement, please contact us to delete it. Contact information: admin@php.cn
Related Article
 Tutorial on making Gantt chart in Excel
21 Dec 2019
The method to create a Gantt chart in Excel is: 1. First prepare the data that needs to be sorted, and adjust the Excel format to [General]; 2. Then select the data, click [Insert], find the bar chart, and select [Stacked Bar Chart] ; 3. Then set the label interval to reverse category, and set the data series format to no padding; 4. Finally restore the date cell format.
 jquery leave flow chart plug-in
11 May 2023
Preface Asking for leave is an inevitable thing at work, and the transparency and standardization of the leave process is crucial to enterprise management, efficiency, and collaboration. Therefore, developing a jQuery leave application flow chart plug-in can not only improve the efficiency of the company's leave application process, but also reduce manpower and enhance the company's competitiveness. 1. Introduction to the plug-in The jQuery leave application flowchart plug-in is a plug-in developed based on jQuery. Its main function is to help enterprises standardize and make the leave application process more transparent. It displays the leave application process in the form of a flow chart to facilitate corporate managers and employees.
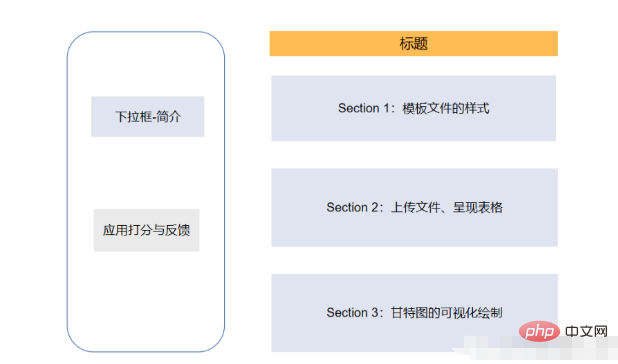 How to implement Gantt chart drawing in Python?
25 Apr 2023
Preliminary preparation: Because we need to use the streamlit, streamlit-aggrid and plotly modules this time, we first download these modules through the pip command. Among them, streamlit-aggrid mainly allows the data table to be presented on the page. pipinstallstreamlit-aggrid is the overall structure of the pipinstallplotly page. The structure is that there is a toolbar on the left, including some brief introductions to the webpage, and a module that hopes users to rate and give feedback. Section1 on the right is the template style of the project planning document, which mainly writes clear tasks in the CSV file. details, including task name,
 How to draw a Gantt chart in react ant
15 Aug 2024
Creating Gantt charts in React Ant using G2, an efficient component for visualizing project timelines. Explores the use of the G2 component and its features, such as optimized algorithms, customizable axes, and interactive elements like tooltips and
 How to cancel the strikethrough in Vue Gantt chart
18 May 2023
Vue is a popular JavaScript framework with many plugins and libraries that can be used in developing web applications, including a Gantt chart plugin. The Gantt chart is a very common project management tool that provides a visual timeline in which the progress and schedule of a project can be displayed. But sometimes when using the Gantt chart plug-in, strikethrough will appear. This article will introduce how to cancel the strikethrough of the Gantt chart plug-in. 1. Understand the meaning of the strikethrough line. In the Gantt chart, the strikethrough line usually indicates that the task or time period has ended or has reached a certain point.
 Loading and performance optimization of Vue statistical chart plug-in
18 Aug 2023
Summary of loading and performance optimization of Vue statistical chart plug-in: Statistical charts are one of the common functions in web applications. The Vue framework provides many excellent plug-ins for rendering statistical charts. This article will introduce how to load and optimize the performance of the Vue statistical chart plug-in, and give some sample code. Introduction: With the popularity of Web applications, data visualization has become one of the focuses of attention in all walks of life. As an important form of data visualization, statistical charts can help users better understand and analyze data. In the Vue framework, there are many excellent
16 May 2016
Some time ago, due to work, I searched for some JS chart plug-ins. The following data was collected on April 8, 2010.
18 Jul 2017
The specific code is as follows:~function(){ function AutoBanner(curEleId,ajaxURL,interval){ //Use the variables that previously stored the retrieved elements as private properties of the current instance this.banner = document.getElementById(curEleId); this.bannerInner = utils.f
 Pure JAVASCRIPT chart animation plug-in Highcharts Examples_jquery
16 May 2016
The official provides a free download package and detailed documentation, which is very worth collecting.


Hot Tools

Frosted glass effect form login interface
A very atmospheric frosted glass effect form login interface

HTML5 cool button particle animation effects
A cool HTML5 button animation that can be used to create burst particle animations
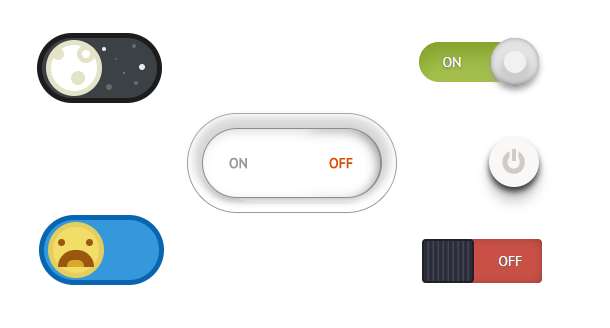
Multiple sets of creative CSS3 switch button codes
Pure css3 to create creative switch button switching.
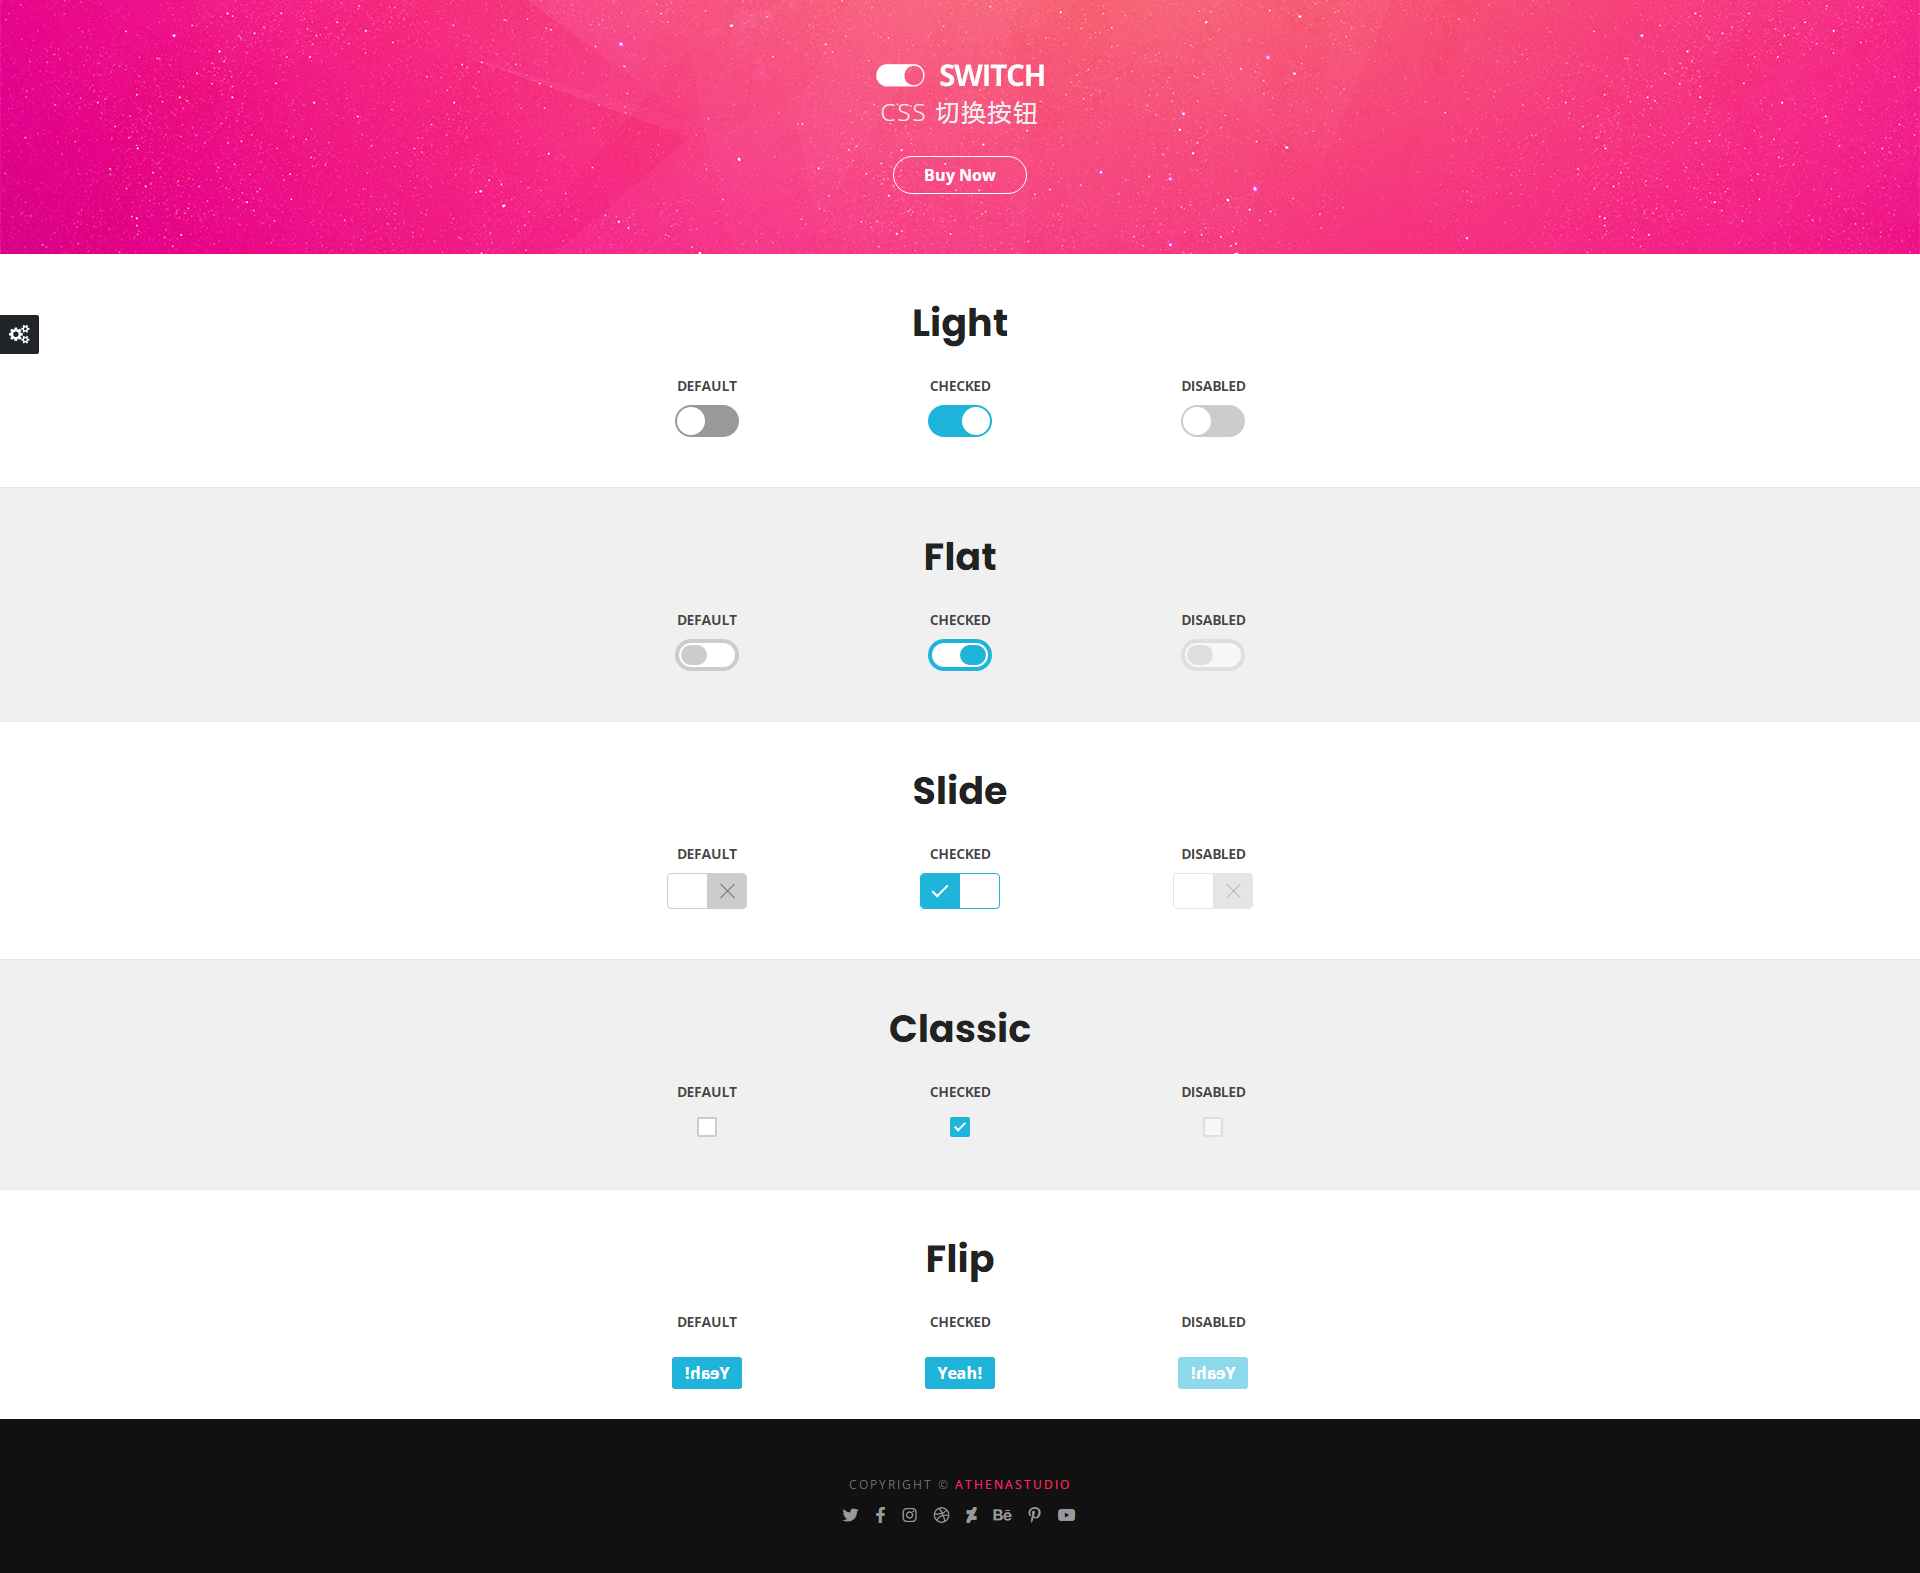
5 classic switching button interaction effects
5 classic switching button interactive effect designs
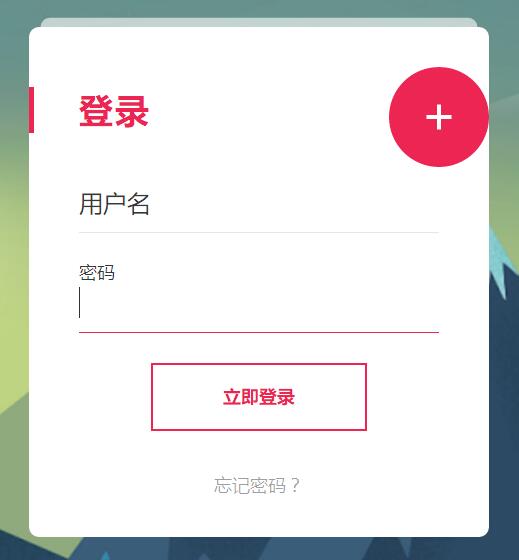
Registration login interface js special effects cool switching code
Registration login interface js special effects cool switching code.


