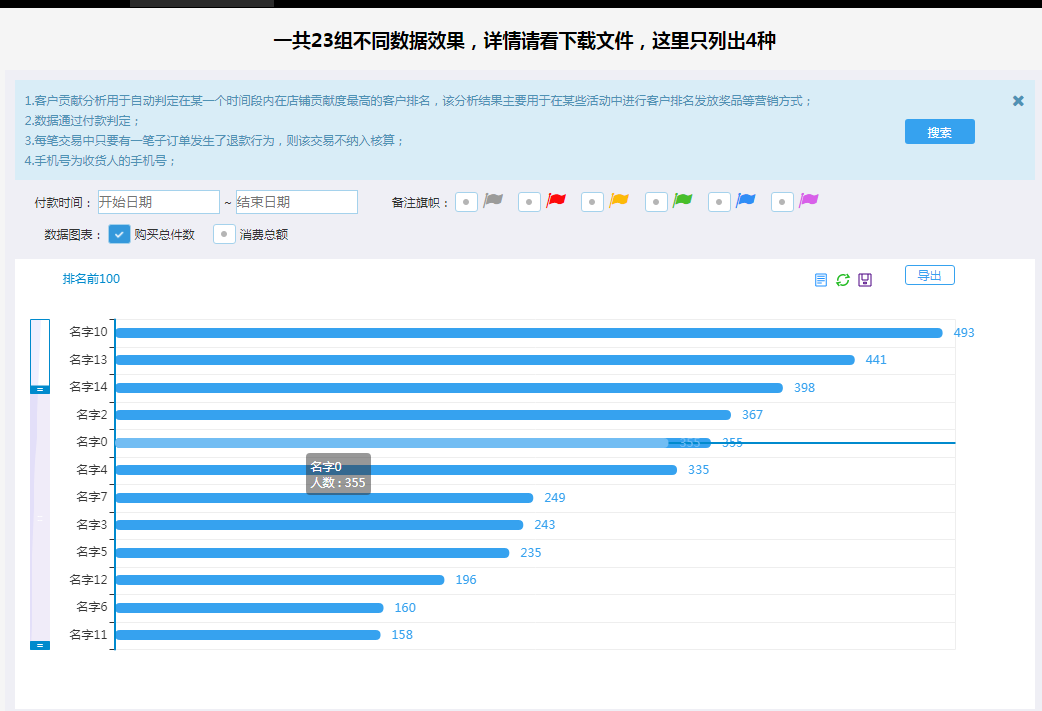
Data analysis, data graphics, chart plug-in echarts
Data analysis, data graphics, charts, and detailed plug-in usage are provided on the page
All resources on this site are contributed by netizens or reprinted by major download sites. Please check the integrity of the software yourself! All resources on this site are for learning reference only. Please do not use them for commercial purposes. Otherwise, you will be responsible for all consequences! If there is any infringement, please contact us to delete it. Contact information: admin@php.cn
Related Article
 Implement statistical chart design for complex data analysis using ECharts and Java interfaces
18 Dec 2023
Use ECharts and Java interfaces to implement statistical chart design for complex data analysis. With the development of big data technology, data analysis has become an indispensable tool in fields such as science, business, and politics. When conducting data analysis, charts are an intuitive, easy-to-understand, and concise way of presentation. ECharts is an excellent JavaScript chart library that provides rich and flexible chart types and interactive functions to meet various data visualization needs. This article will introduce how to use EChar
 Statistical chart design for multi-dimensional data analysis based on ECharts and Java interface
17 Dec 2023
Title: Statistical chart design for multi-dimensional data analysis based on ECharts and Java interface Abstract: With the advent of the big data era, data analysis plays an increasingly important role in various industries. This article will introduce how to use ECharts and Java interfaces to implement statistical chart design for multi-dimensional data analysis. Through specific code examples, readers can understand how to use ECharts for data visualization, and how to obtain data through the Java interface for multi-dimensional statistical analysis. I hope this article will be useful for logarithms
 How to use rose chart to display data proportion in ECharts
17 Dec 2023
How to use a rose chart to display data proportions in ECharts Summary: A rose chart is a visual data analysis tool that can be used to display data proportions. This article will introduce how to use the ECharts library to draw a rose chart in a web page, and provide specific code examples. Introduction: In data analysis and visualization, the rose chart is a commonly used chart type. Its characteristic is that the center of the circle is the origin and the proportion of data is displayed as different sector angles. Through the rose chart, we can visually compare the proportions of different categories of data. EChart
 How to use pictogram bar chart to display data in ECharts
17 Dec 2023
How to use pictograms to display data in ECharts requires specific code examples. In the field of data visualization, ECharts is a powerful, easy-to-use open source visualization library. It provides a wealth of chart types that can help us display data in an intuitive way. Among them, the pictographic column chart is an intuitive and interesting chart type that can display data in vivid graphics. This article will introduce how to use pictograms to display data in ECharts and provide specific code examples. First, we need
 How to use scatter matrix chart to display data relationships in ECharts
17 Dec 2023
How to use scatter matrix charts to display data relationships in ECharts requires specific code examples. ECharts (EnterpriseCharts) is an open source data visualization library based on HTML5Canvas launched by Baidu, which provides a wealth of chart types and interactive features. Among them, scatter matrix plot is a commonly used data visualization method that can visually display the relationship between multiple variables. This article will introduce how to use scatter matrix charts in ECharts to display data relationships and provide
 Use ECharts and Java interfaces to implement statistical chart design in multiple data formats
17 Dec 2023
Use ECharts and Java interfaces to implement statistical chart design in multiple data formats. With the popularity of the Internet and the continuous expansion of data collection, data processing and visualization have become an important requirement. Statistical charts are an important way of data visualization. This article will introduce how to use ECharts and Java interfaces to implement statistical chart design in multiple data formats. 1. Introduction to ECharts ECharts is an open source visualization library based on JavaScript, developed by Baidu's front-end technology department.
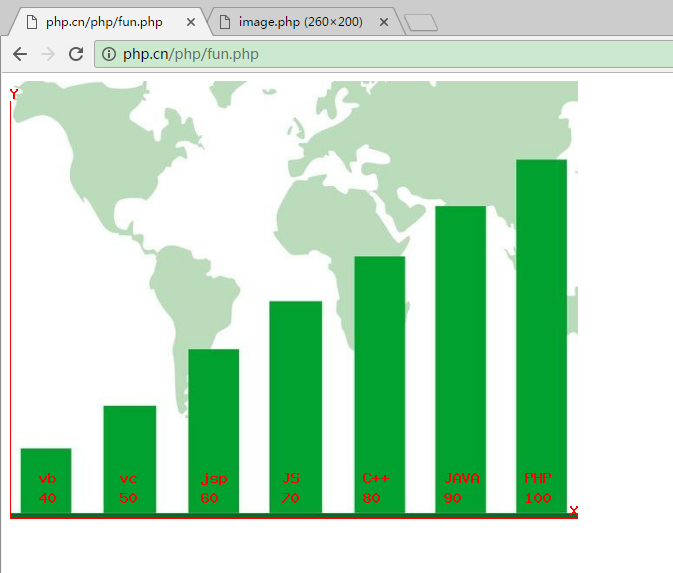 Use GD2 function to implement chart analysis of product data (Typical application tutorial of PHP graphics and images 6)
24 Apr 2017
Using charts to analyze product data information is currently the most commonly used data management model for large and medium-sized enterprises. Analyzing products through charts can not only make it clear at a glance, but also make timely decisions on the next step of product planning, quickly improving the economic benefits of the enterprise. It can be seen that, Using charts to analyze product data trends is the foundation for the rapid development of an enterprise. This article is about analyzing product data with charts!
 How to use funnel rose chart to display data proportion and conversion rate in ECharts
18 Dec 2023
Overview of how to use the funnel rose chart to display data proportion and conversion rate in ECharts: The funnel rose chart is a commonly used data visualization chart that can clearly display the data proportion and conversion rate. In ECharts, we can easily achieve the display effect of funnel rose chart through simple data processing and configuration. This article will introduce how to use the funnel rose chart in ECharts to display data proportion and conversion rate, and provide corresponding code examples. Step 1: Prepare the data First, we need to prepare the data to be displayed
 How to use Sankey Rose Chart to display data flow and proportion changes in ECharts
18 Dec 2023
ECharts is a visual data display library that can make data more vivid and intuitive. Among them, the Sankey Rose chart can provide great help in showing the data flow direction and proportion changes. This article will introduce how to use the Sankey Rose Chart in ECharts, while providing specific code examples. Introduction The Sankey rose diagram is a special rose diagram that displays data through concentric rings of inner and outer circles and sector lengths. It has a clear hierarchical structure and is suitable for displaying multi-dimensional data flow. In ECharts, the Sankey Rose chart can be used to display


Hot Tools

Frosted glass effect form login interface
A very atmospheric frosted glass effect form login interface

HTML5 cool button particle animation effects
A cool HTML5 button animation that can be used to create burst particle animations
Multiple sets of creative CSS3 switch button codes
Pure css3 to create creative switch button switching.
5 classic switching button interaction effects
5 classic switching button interactive effect designs

Registration login interface js special effects cool switching code
Registration login interface js special effects cool switching code.


