Found a total of 10000 related content
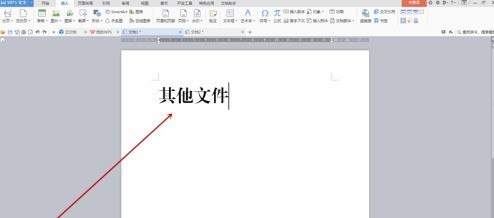
How to create file labels using Founder Xiaobiao Song simplified font_How to create file labels using Founder Xiaobiao Song simplified font
Article Introduction:First, use Founder's small standard Simplified Song to input the label content in a blank document, adjust the font size, and then move the cursor to the middle of every two words and press the Enter key to make the text vertical. Select all vertical text, click the [Table] drop-down menu button in the [Insert] tab of the toolbar, and select [Convert Text to Table] in the pop-up menu. After the dialog box pops up, there is no need to change the settings. Click the OK button to close the dialog box. You can see the effect in Figure 2 below. Right-click on the selection to pop up the menu and select [Borders and Shading]. After the dialog box pops up, use the mouse to click on the center line border pointed by the red arrow in Figure 1 below. When the center line disappears, click the OK button to close the dialog box. At this time, the center line of the table has completely disappeared, leaving only a large border. Move mouse to right
2024-06-10
comment 0
501
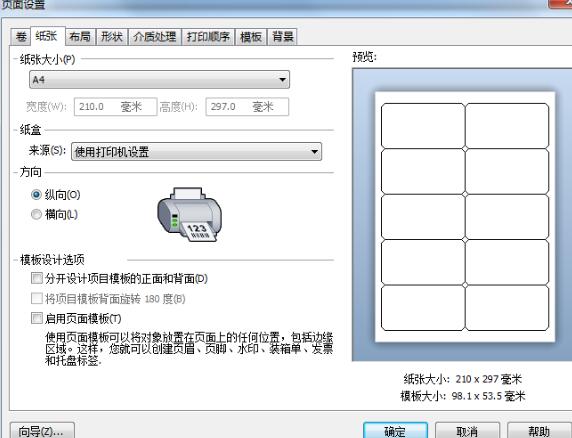
Introduction to the method of adjusting label gap in BarTender
Article Introduction:1. In BarTender, double-click the blank space of the label, or click the Page Setup button in the toolbar. Opens the Page Setup dialog box. Set the paper size and orientation in the [Paper] tab. 2. Switch to the [Layout] tab and set the number of rows and columns of labels; in the [Spacing] column, check [Manual setting] to set the gap between labels in each row and column. (Default is 0). 3. Click OK to print the preview effect:
2024-04-08
comment 0
1101
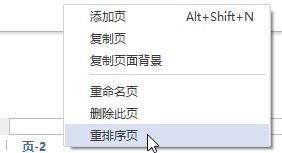
How to Reorder Pages in Edraw Flowchart Making Software
Article Introduction:In the lower left corner of the drawing page, right-click the page label. Select the reorder page. Adjust the page order in the pop-up dialog box, and then click OK. Note: If you choose the default page number format, such as page-1, when reordering pages, if Automatically update page names is selected, Edraw will rename the pages.
2024-06-02
comment 0
820

How to design movie countdown animation using PPT
Article Introduction:Insert a horizontal text box into the PPT page, enter the number 321, set the text size and color, etc. (You can also insert a background for the page). Select the text box, click the [Font Spacing] button in the [Start]-[Font] group, select the [Other Spacing] option, open the [Font] dialog box, set [Spacing] to [Compact], and the measurement value to [180] . Select the text box, click [Animation]-[Animation Style]-[Appear], and then click [Add Animation]-[Disappear]. At this time, click the [Animation Pane] button to open the animation pane, and you can see the two animations just added. Select animation 1, right-click the mouse, select [Effect Options], and in the [Appear] dialog box that opens, set [Animation Text] to [By Letter], [Delay Between Letters]
2024-04-17
comment 0
582

Detailed method of designing animation using action buttons in Geometric Sketchpad
Article Introduction:1. Determine the animation target: point, line, shape. In the mathematics courseware production tool, you can use the line segment tool to create a line segment. Select the endpoints A and B on the text toolbar, and then use the point tool to make any point C on the line segment AB. as the picture shows. 2. Select the animation target, execute the animation command, select point C with the move tool, and execute the [Edit] - [Operation Button] - [Animation] command, as shown in the figure. 3. After setting the speed, direction, and label to execute the animation command, the animation button properties dialog box will pop up. Set the movement direction to two-way, then the speed to medium speed, and finally click OK. 4. To demonstrate the animation of point C on line segment AB, click the animation point operation button with the mouse, and you can see the animation of point C moving left and right on line segment AB, thus realizing the use of
2024-04-08
comment 0
682
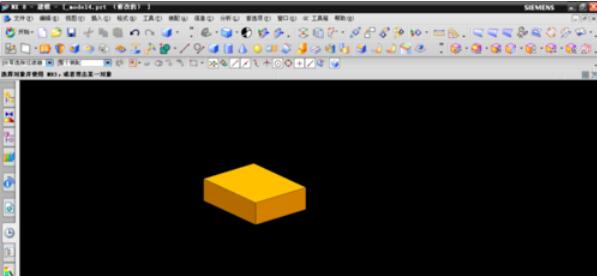
The method of extending the model to the entity in UG8.0 software
Article Introduction:Open the ug main program and create a new file. Draw a cuboid and click the start button - click [All Application Modules] at the bottom - find [Electrode Design] and click the third icon from the bottom as shown below [Extended Entity] to pop up the Extended Entity dialog box. Select a surface on the body at random, as shown in the picture, enter the distance in the second line of the dialog box [Offset Value], for example, 100, click the OK button in the dialog box to get the effect as shown in the picture below.
2024-06-04
comment 0
1022
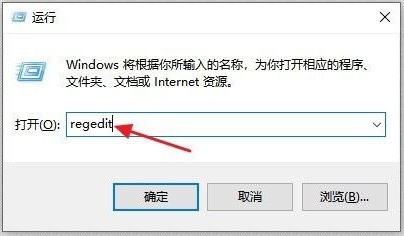
What to do if win10 computer cannot open exe suffix file_Win10 computer cannot open exe suffix file
Article Introduction:1. Use the Win+R shortcut key to enter the [Run] dialog box, enter [regedit], and click OK. 2. Select the [HKEY_CLASSES_ROOT" folder under the computer on the left, double-click or click the ">" button on the left. 3. Roll the mouse wheel or drag the scroll bar on the side of the window downward to find the folder with the suffix ".exe" and click it. 4. Double-click the Default [Option] on the right side of the window. 5. In the dialog box that pops up, enter [exefile] under [Numeric Data] and click OK. 6. Continue to pull down the scroll bar on the left window, find the [exefile] folder, double-click or click on the left 】>&
2024-06-03
comment 0
374

How to turn photos into oil paintings with FastStone Capture How to turn photos into oil paintings
Article Introduction:First, open FastStoneCapture on the computer and open the original material display. Then, in the menu bar above, find the special effects menu bar. Then, under the special effects menu bar, select Oil Painting to pop up an oil painting dialog box. Change the settings according to your needs. In the oil painting dialog box, change the value to 10. Click OK. After the production is completed, the effect will be displayed.
2024-05-09
comment 0
470

How to add frames to pictures in FastStone Capture How to add frames
Article Introduction:First, open the image in FastStoneCapture. Then, click Expand Canvas under the Edit menu bar. Then, in the dialog box, change the expansion value width and height to 100; position it in the middle; change the color of the canvas. Usually the default color is the background color. Select the color here. White, and finally click OK to confirm that the set value is OK, then click OK again. The border is completed, and the effect is as shown in the picture below.
2024-05-09
comment 0
914

How to draw logarithmic function images on geometric sketchpad
Article Introduction:Method 1: Use the base-changing formula to execute the [Draw] command, enter logx/log4 in the pop-up dialog box, and click [Confirm]. Among them, log is entered by clicking [Function], x and 4 are entered by clicking numbers, and [/] is [÷]. Method 2 uses the inverse function method to define the coordinate system. Open the geometric sketchpad, click the [Draw] menu above, and select the [Define Coordinate System] command from its drop-down menu to establish a Cartesian coordinate system. Find the inverse function. Execute the [Draw]-[Draw New Function] command, click the [Equation] button in the pop-up dialog box, and select [x=f(y)] from the pop-up drop-down option. Plot the graph of the function. y is equal to the logarithm of x with base 4. In the Draw New Function dialog box, enter [4, ^, y] and click OK.
2024-04-17
comment 0
703

The related process of inputting subscripts of letters on the geometric sketchpad
Article Introduction:Draw the graph. Open the geometric sketchpad software and draw the geometric figures you need on the sketchpad. For example, use the [Polygon Tool] to draw the pentagon as shown in the picture. Click a vertex in the graph, and the vertex will be marked with a red circle. Then use the mouse to click the [Display] menu in the menu bar above the drawing board, and click the [Point Label] item in the drop-down list. A dialog box will appear, as shown in the figure. In the dialog box, enter the corresponding letter, such as A. Then, after the letter, use the symbols and numbers on the computer keyboard to enter [1], and then click OK. The letter subscript 1 will appear. In the square brackets If you type 2 here, the subscript will be 2.
2024-04-17
comment 0
1222
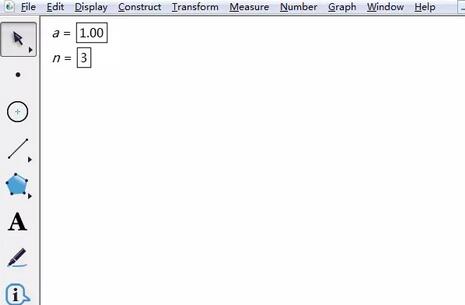
The specific method of drawing the three-leaf rose line on the geometric sketchpad
Article Introduction:Open the geometric sketchpad, click the [Data] menu in the upper menu bar, select the [New Parameter] command in the drop-down menu, create new parameters a=1, n=3 in the pop-up dialog box, and select None for the unit. Step 2 To draw the three-leaf rose line, click the [Drawing] menu in the upper menu bar, select the [Draw New Function] command, click [Equation] in the pop-up dialog box, select r=f(θ), and enter the expressions as shown in the figure. formula, click [OK]. A dialog box will pop up asking whether to establish a polar coordinate system for the triangular coordinate axes. Click [Yes] to automatically establish a polar coordinate system. implement
2024-06-07
comment 0
937
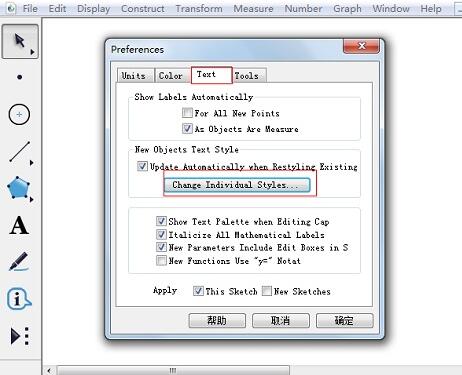
Detailed method for enlarging coordinate axis scale numbers of Geometry Sketchpad
Article Introduction:Method 1: Modify the default settings of the sketchpad before drawing 1. Open the geometric sketchpad, select [Edit] - [Preferences], select the [Text] option in the pop-up preset dialog box, and click [Change Object Properties]. 2. In the pop-up text style dialog box, select [Number on the axis], select the corresponding font and font size from the drop-down menu on the right, and then click the [OK] button. 3. Select [Drawing] - [Define Coordinate System], and you can see that the scale numbers of the coordinate axis have become larger. Method 2: Use shortcut keys to modify the coordinate axis scale numbers. Select [Drawing] - [Define Coordinate System] to open the default coordinate axis of the geometric sketchpad. At this time, we feel that the default scale numbers are too small. Select the coordinate axis (including x-axis and y-axis) and press the shortcut key [Alt+>].
2024-04-17
comment 0
614

How to set the font size in autocad2010_How to set the font size in autocad2010
Article Introduction:1. First, open the CAD software on your computer, and then select the icon with the letter [A] below. You can also find [Insert] in the taskbar, select [Text], and multi-line text: 2. After clicking, a message will appear behind the mouse. There are [abc] characters, then click the following in the blank space of the screen, then drag to enlarge the text input box and enter the text [network]: 3. Enter the two words [network] here, and click directly outside the text box after input position, that is, the input of text is completed: 4. Right-click the mouse position at the text position, select [Properties] at the bottom, and the following dialog box will pop up: 5. Then select [Text Height] in the dialog box, and click the number on the right. Enter the desired text height, click the Enter key to confirm, and close this dialog box: Pass
2024-05-08
comment 0
967
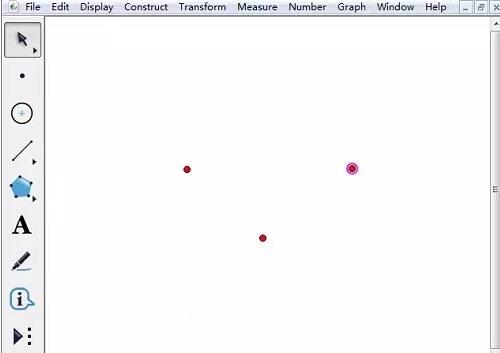
Detailed method for creating dynamic quadratic functions using geometric sketchpad
Article Introduction:Open the geometric sketchpad, select the [Point Tool], and click any number of points in the workspace (depending on the number of parameters of the function you create. What is demonstrated here is a quadratic function, so three points are established). Select [Moving Arrow Tool], select any point we just created, right-click, select Properties, click Label Options, enter [a], and click [Show Label] below, and click OK. Use the same method to change the labels of the remaining two points to b and c. Right-click on each point and select the abscissa or ordinate (you can choose either one, the difference will be explained later). Select the three small boxes that appear in the upper left corner, right-click elsewhere in the workspace and select [Draw New Function]. In the pop-up New Function dialog box, click
2024-04-17
comment 0
1136
Relevant steps for drawing a four-leaf clover on a geometric sketchpad
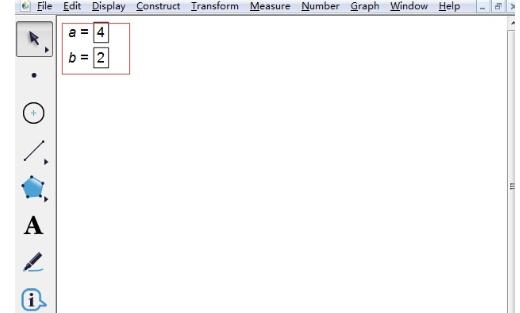
Article Introduction:Step 1: Create new parameters. Open the geometric sketchpad, click the [Data] menu in the upper menu bar, select the [New Parameter] command in the drop-down menu, create new parameters a=4, b=2 in the pop-up dialog box, and select None for the unit, as shown in the figure. Step 2 To draw a new function, click the [Draw] menu in the upper menu bar, select the [Draw New Function] command in the drop-down menu, click [Equation] in the pop-up dialog box, select r=g(θ), and enter in sequence as shown in the figure. expression, click [OK]. A dialog box will pop up, asking whether to establish a polar coordinate system for the triangular coordinate axes. Click [Yes] to automatically establish a polar coordinate system, and at the same time, the image of the four-leaf rose line will be drawn in the coordinate system.
2024-04-16
comment 0
752

How to set up automatic content addition in BarTender
Article Introduction:1. Run the BarTender software and create a single line of text in the label with the value [2]. Then, double-click the text to open the Text Properties dialog box. 2. Select the data source, switch the interface on the right to [Conversion], and click the serialization setting button behind the [Serialization] field. 3. In the pop-up serialization setting dialog box, check [Increment]. Here, take the initial value as 2 and automatically increase by 6 for every 6 tags as an example. Set [Increment value] to 6, and make a copy of each serial number. The number is 6 and click OK. Note: Please pay attention to the check box of [Number of reserved characters] and select it according to your actual requirements. 4. At this time, click print or preview labels to print in a mode that automatically increases by 6 for every 6 labels. The preview effect is as follows:
2024-04-08
comment 0
636
A graphic method for drawing function images within a limited range using geometric sketchpad
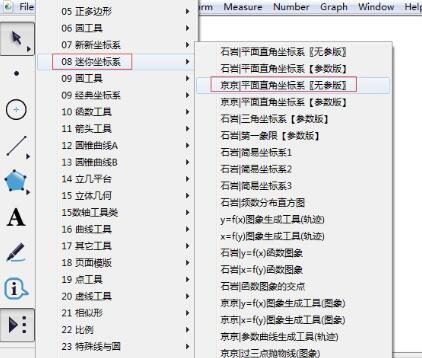
Article Introduction:Create a coordinate system. Open the Geometry Sketchpad, create a new blank file, click [Customize Tools] on the left sidebar, select Mini Coordinate System, Jingjing | Oriental Coordinate System [No Parameter Version], pull out a coordinate system, and click System Initialization. Plot the graph of the function. Click the [Drawing] menu in the upper menu bar, select Draw a new function from its drop-down option, enter a function expression such as y=1/x in the pop-up dialog box, and click OK to draw the image within the entire definition domain. Thinking: What should I do if I want to draw an image on the closed interval [-4, 4]? Select the function image, right-click, and select Properties. Click the drawing tab in the pop-up dialog box, enter the specified range [-4, 4], click OK, and the function image as shown in the figure is drawn. Thinking: follow the above method
2024-04-16
comment 0
1038

ppt2013 steps to fill pictures into graphics
Article Introduction:Open the software and create a new ppt document. Set the document to be blank, or you can choose to cut out the text boxes. Insert - Shape - a drop-down box will pop up. Select an icon shape in the pop-up drop-down box. Draw the icon in a blank document. Right-click the icon you just drew and click Format Object in the pop-up dialog box. In the pop-up object format box, select the fill color item and click the small triangle behind it. In the popup dialog box below, select the picture option. Select the image you want to set and click OK. The final effect is shown in the figure.
2024-04-17
comment 0
831

How to draw a sinusoidal curve with Geometric Sketchpad How to draw a sinusoidal curve with Geometric Sketchpad
Article Introduction:Step 1: Click the desktop geometric sketchpad icon to start the geometric sketchpad (as shown in the figure). Step 2: Click [Draw] on the menu bar and select [Define Coordinate System] from the drop-down menu (as shown in the figure). Step 3: Click [Drawing] on the menu bar and select [Grid Style] and [Triangular Coordinate Axis] from the drop-down menu (as shown in the figure). Step 4: Click [Draw] on the menu bar and select [Draw New Function] from the drop-down menu (as shown in the figure). Step 5: From the pop-up function dialog box, click [Function] and select sin (as shown in the figure). Step 6: In the dialog box, complete the sine function, and then click [OK] (as shown in the figure). Step 7: The graph of the trigonometric sine function is drawn successfully (as shown in the figure).
2024-06-07
comment 0
632


