Found a total of 10000 related content

Chart library and its application in PHP
Article Introduction:With the development of the Internet, data visualization has become an increasingly important skill. On websites or applications, data can be displayed more intuitively through charts, making it easier for users to understand. In PHP development, there are many chart libraries to choose from. This article will introduce some commonly used PHP chart libraries and their applications. GoogleChartsGoogleCharts is a free chart library provided by Google that supports multiple types of charts, such as line charts, bar charts, pie charts, etc. GoogleCharts by J
2023-06-23
comment 0
1096

9 classic and gorgeous html5 chart applications
Article Introduction:When it comes to chart applications, web charts made with HTML5 and jQuery are more convenient and usable, and they are more flexible to customize in terms of function and appearance. This article will share with you 9 classic and gorgeous HTML5 chart applications. It may be helpful to your front-end development. Let’s take a look.
2018-03-21
comment 0
2990
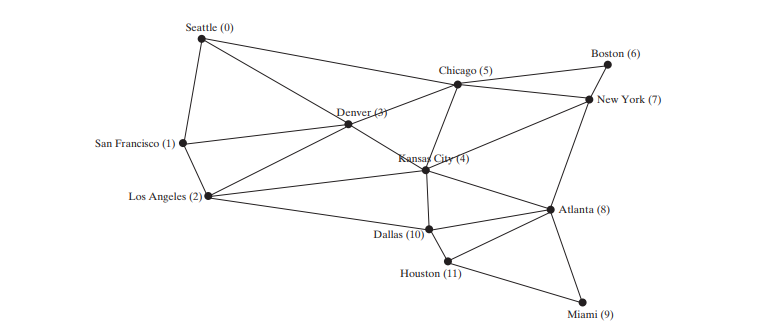
Graphs and Applications
Article Introduction:Many real-world problems can be solved using graph algorithms. Graphs are useful in modeling and solving real-world problems. For example, the problem to find the least number of flights between two cities can be modeled using a graph, where the vert
2024-08-09
comment 0
589

Display Chart in Express.js App using CanvasJS
Article Introduction:Express.js is a powerful tool for creating server-side applications, and CanvasJS makes it easy to visualize data with interactive charts. This tutorial will show you how to integrate the two for a seamless charting experience in your Express.js appl
2024-12-03
comment 0
411
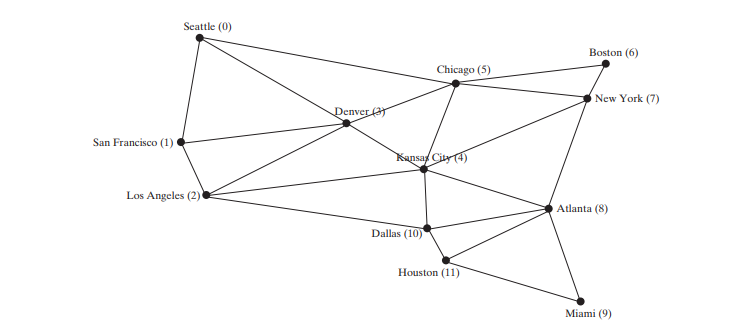
Weighted Graphs and Applications
Article Introduction:A graph is a weighted graph if each edge is assigned a weight. Weighted graphs have many practical applications.
Figure above assumes that the graph represents the number of flights among cities. You can apply the BFS to find the fewest number of
2024-09-06
comment 0
766

PHP and Vue.js Development Guide: How to Apply Statistical Charts in Data-Intensive Applications
Article Introduction:PHP and Vue.js Development Guide: How to Apply Statistical Charts in Data-Intensive Applications Introduction: In data-intensive applications, statistical charts are a very important way of displaying data. This article will introduce how to use PHP and Vue.js to develop an application that supports statistical charts, and provide code examples. 1. Introduction Statistical charts are an effective way to present large amounts of data and help users better understand and analyze the data. In data-intensive applications, how to apply statistical charts becomes an important issue. This article will be written via PHP
2023-08-18
comment 0
1175
Detailed introduction about 9 classic and gorgeous HTML5 chart applications
Article Introduction:In the previous article, we have shared 8 very good Java chart applications, but when it comes to chart applications, web charts made with HTML5 and jQuery are more convenient and usable, and they are easier to customize in terms of function and appearance. flexible. This article will share with you 9 classic and gorgeous HTML5 chart applications. It may be helpful to your front-end development. Let’s take a look. 1. Super cool HTML5 Canvas chart application Chart.js Today we are going to introduce Chart.js, a chart application based on HTML5 Canvas. It is very powerful and has many chart types...
2017-03-06
comment 0
1509

Implement adaptive responsive statistical chart design using ECharts and Java interfaces
Article Introduction:Using ECharts and Java interfaces to implement adaptive responsive statistical chart design. In the field of modern data visualization, the design and display of statistical charts is a very important part. In web applications, we often need to use some open source tools to help us implement such functions. ECharts is a very popular open source charting library that provides a wealth of chart types and various custom configuration options. This article will introduce how to use ECharts and Java interfaces to implement adaptive responsive statistical charts.
2023-12-18
comment 0
1423

How to use Vue to implement responsive statistical charts
Article Introduction:How to use Vue to implement responsive statistical charts In modern data visualization work, statistical charts are a very important part. As a popular JavaScript framework, Vue can help us build responsive user interfaces and easily integrate statistical charts. This article will introduce how to use Vue to implement responsive statistical charts, and attach code examples. First, we need to install Vue and introduce the Vue library into the project. <scriptsrc="https:/
2023-08-17
comment 0
797

Vue and Canvas: How to implement visual chart applications
Article Introduction:Vue and Canvas: How to implement visual chart applications Introduction: With the development of the Internet, visual chart applications are widely used in all walks of life. In web development, Vue and Canvas are two commonly used tools. This article will introduce how to combine Vue and Canvas to implement visual chart applications, and provide corresponding code examples. 1. Introduction to Vue Vue is a progressive framework for building user interfaces. It can realize dynamic data through parsing and rendering of HTML templates
2023-07-17
comment 0
1187

Advanced application and case analysis of Python chart drawing
Article Introduction:Advanced application and case analysis of Python chart drawing Chart drawing is an important part of data visualization. Python, as a widely used programming language, also provides a rich drawing library. In this article, we will explore the advanced applications of Python for charting and demonstrate specific code examples through actual case analysis. 1. Basic use of the Matplotlib library Matplotlib is one of the most commonly used drawing libraries in Python. It provides a wealth of drawing functions and classes that can draw various classes.
2023-09-27
comment 0
1239

How to use Vue to implement adaptive layout statistical charts
Article Introduction:Overview of how to use Vue to implement adaptive layout of statistical charts: In modern web applications, statistical charts are an important part of displaying data. Using Vue.js you can easily implement adaptive layout of statistical charts to adapt to different screen sizes and device types. This article will introduce how to use Vue and some commonly used charting libraries to achieve this goal. Create a Vue project and install dependencies First, we need to create a Vue project. You can use VueCLI to quickly build the project structure. In terminal run as
2023-08-20
comment 0
993

5 recommended articles about chart applications
Article Introduction:xCharts - Detailed code explanation of D3-based JavaScript chart library (picture) xCharts is a JavaScript chart library based on D3. xCharts is very powerful. It not only supports a variety of chart types, but also has rich chart theme styles and is very beautiful. In addition, the design of xCharts is very flexible, the configuration is relatively simple, and the loading speed is not bad. It is a JavaScript chart application that is very open and customizable. The features of xCharts are based on JavaScript, so...
2017-06-13
comment 0
1269

The difference between MySQL views and tables and their application scenarios
Article Introduction:The difference between MySQL views and tables and their application scenarios. A view in MySQL is a virtual table. It is a visual table based on the SQL query result set and can be queried, updated or operated like a table. Views play an important role in database design. They can simplify complex data operations and improve data security and maintainability. In practical applications, views and tables have their own advantages and applicable scenarios. 1. The difference between MySQL views and tables is defined as follows: Table is the basic storage in the database
2024-03-16
comment 0
1196

Applications, advantages and disadvantages of charts
Article Introduction:Diagrams are used in different disciplines. They are used in biology to represent gene interactions, for route optimization in transportation, and for analysis of user connections in social networks. A chart's visual representation of complex relationships and its ability to observe patterns and trends are two of its strengths. However, working with large data sets can make charts unwieldy and difficult to understand. Additionally, creating charts can take time and knowledge. Despite these shortcomings, graphs remain an effective tool for interdisciplinary data analysis and decision-making. Methods Used Setting Representation Link Representation Sequence Representation Setup Representation Each vertex in the graph is associated with a set containing its surrounding vertices, which represents the graph. In this approach, the edges of the graph are stored in an adjacency set or hash table containing the set. set of each vertex
2023-08-29
comment 0
994

Recommend 10 commonly used responsive chart usages, welcome to download!
Article Introduction:Powerful JavaScript responsive chart Chartist.jsChartist.js is a very simple and practical JavaScript front-end chart generator. It supports SVG format, chart data conversion is very flexible, and it also supports a variety of chart presentation forms. It can be regarded as a front-end developer development tool. The feature configuration of Chartist.js is very simple and can easily convert various chart data formats. CSS and JavaScript are separated, so the code is relatively concise and relatively easy to use. Using the SVG format,...
2017-06-12
comment 0
1470

In-depth understanding: Principles and applications of Python chart drawing
Article Introduction:In-depth understanding: Principles and applications of Python charting Introduction: Charts are one of the important means of data visualization. They can visually display the distribution, trends and correlations of data, helping people better understand the data. As a powerful programming language, Python has rich drawing libraries, such as Matplotlib, Seaborn and Plotly, etc., which can realize various types of chart drawing. This article will start with the principles and basic concepts of chart drawing, and introduce the commonly used drawing libraries in Python and their
2023-09-27
comment 0
754


