Found a total of 10000 related content

React code debugging guide: How to quickly locate and solve front-end bugs
Article Introduction:React code debugging guide: How to quickly locate and resolve front-end bugs Introduction: When developing React applications, you often encounter a variety of bugs that may crash the application or cause incorrect behavior. Therefore, mastering debugging skills is an essential ability for every React developer. This article will introduce some practical techniques for locating and solving front-end bugs, and provide specific code examples to help readers quickly locate and solve bugs in React applications. 1. Selection of debugging tools: In Re
2023-09-26
comment 0
1504
调试SQLSERVER (二)使用Windbg调试SQLSERVER的环境设置
Article Introduction:调试SQLSERVER (二)使用Windbg调试SQLSERVER的环境设置 调试SQLSERVER (一)生成dump文件的方法 调试SQLSERVER (三)使用Windbg调试SQLSERVER的一些命令 大家知道在Windows里面,调试可以分为两个领域: 1、内核态调试 2、用户态调试 一般的程序都是运行
2016-06-07
comment 0
1169
调试SQLSERVER (三)使用Windbg调试SQLSERVER的一些命令
Article Introduction:调试SQLSERVER (三)使用Windbg调试SQLSERVER的一些命令 调试SQLSERVER (一)生成dump文件的方法 调试SQLSERVER (二)使用Windbg调试SQLSERVER的环境设置 windbg命令分为 标准命令、 元命令、 扩展命令 标准命令提供最基本的调试功能,不区分大小写。如:
2016-06-07
comment 0
2036

How to debug functions using Golang debugger?
Article Introduction:Using the dlv debugger, you can debug functions by following these steps: Install dlv Set breakpoints (dlvbreakfuncName) Start debugger (dlvdebug) Run program (dlvcontinue) Check variables (dlvprintvarName) Step into execution (dlvnext) Continue execution (dlvcont)
2024-04-17
comment 0
817


Debugging in C++ technology: Custom debugger integration and extension
Article Introduction:C++ debugging techniques can be enhanced through custom debugger integration and extension, including the following steps: Integrate a custom debugger: Create an adapter, load it into the application, configure the debugger to use it. Extended Debugger: Add custom commands and functionality through the extension mechanism to meet specific debugging needs. In actual combat, debugger extensions are used to create visual tools to help debug objects in the game world and improve debugging efficiency of complex game states.
2024-05-09
comment 0
1172

pycharm debugging tutorial
Article Introduction:The pycharm debugging tutorial is as follows: 1. Preparation; 2. Run the code; 3. Enter Run/Debug mode; 4. Save run/debug configuration information; 5. Official operation; 6. Run the test program; 7. Select a tester; 8. Create a test program block; 9. Run the test code; 10. Debug the run; 11. Breakpoints; 12. Set breakpoints; 13. Code debugging; 14. Run again; 15. REPL, debug the program in the console interface.
2023-12-19
comment 0
2076

How to debug C++ unit tests using Boost.Test?
Article Introduction:How to debug C++ unit tests using Boost.Test? Install the Boost.Test library. Enable debugging by specifying the BOOST_TEST_DYN_LINK macro. Set breakpoints in the function under test. Run the test program, trigger breakpoints, and then use the debugger to step through the test. Check function behavior and find errors.
2024-06-04
comment 0
954

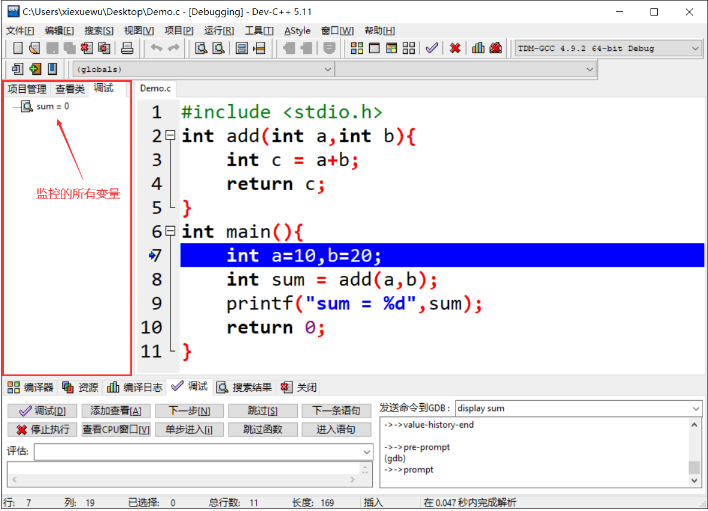
How to debug dev c? -dev c Chinese debugging
Article Introduction:Use and debugging of devc: 1. Use breakpoint debugging if it cannot be debugged: Tools –> Compile options –> Code generation/optimization –> Connector –> Generate debugging information –> Change no to yes. Basic steps for debugging; 1. Change the release mode in the upper right corner to debug mode 2. Set breakpoints 3. Click Compile All and click the check mark (a blue arrow indicates that the statement has not been executed yet and is about to be executed, but there are more than one blue line) , variables can be viewed in two ways after debugging, ① Add View to enter the variable value and view ② Select the variable or expression and click Add View to see the variable value in the left column) Of course, through the terminal The console can also observe the value of variables
2024-03-18
comment 0
840

Debugging and testing of golang functions
Article Introduction:There are three techniques for debugging and testing Go functions: using the debugger dlv to step through the code, inspect variables, and modify the code state. Test functions by writing test functions in the _test.go file and verifying the results using assertion functions. In actual combat, you can use dlv to debug the execution of the function, and use the test framework and assertion function to verify the correctness of the function.
2024-04-28
comment 0
1137

PHP REST API testing and debugging methods
Article Introduction:PHPRESTAPI testing and debugging methods: Unit testing: Isolate code modules and verify output. Integration testing: Testing API component collaboration. End-to-end testing: simulate the complete user flow. Debugging tools: logging, debuggers, and API testing tools. Assertion verification: Use assertions in tests to check expected results.
2024-05-31
comment 0
810

How to debug Golang functions using remote debugging?
Article Introduction:The steps to use remote debugging in Golang functions are as follows: Enable listening in the program: import_"net/http/pprof" Build and run the program: gorun-listen=0.0.0.0:1234main.go Set up the debugger in the IDE and connect to run program of. Set breakpoints. Run the debugger, attached to the running program.
2024-04-18
comment 0
1283

How to fix: Java debugging error: Inaccurate debugging information
Article Introduction:How to solve: Java debugging error - debugging information is inaccurate Introduction: During the Java development process, you often encounter situations that require debugging. However, sometimes we find that the debugging information is inaccurate, which brings us some trouble in locating and solving the problem. This article will introduce several common cases of inaccurate debugging information and their solutions to help developers better troubleshoot and solve Java debugging problems. 1. NullPointException exception does not specify the specific location NullPointExc
2023-08-19
comment 0
1675

Recommended PHP debugging tools: How to use the xdebug plug-in for debugging
Article Introduction:Recommended PHP debugging tools: How to use the xdebug plug-in for debugging Introduction: In the PHP development process, debugging is a very important link. Debugging tools can help developers locate and solve problems in the code and improve development efficiency. This article will introduce xdebug, a commonly used PHP debugging tool, and provide some usage examples to help readers better use xdebug for debugging. 1. What is xdebug? xdebug is an open source debugging tool extension for PHP that can be provided in the development environment
2023-07-30
comment 0
1514

How to debug breakpoints in pycharm
Article Introduction:Perform breakpoint debugging in PyCharm, including: opening the debugging toolbar; setting breakpoints (click the blank line number area on the left); starting debugging (debugger drop-down menu); executing code step by step (Step Over, Step Into, Step Out ); View variables and expressions (hover or enter the debugger variables pane); Continue debugging (Continue button or F9); Remove breakpoints (click the red dot or use the Remove All Breakpoints button).
2024-04-18
comment 0
1422

How to use Ray to debug interactive debugging of PHP functions?
Article Introduction:How to debug PHP functions with Ray? 1. Install Ray: Use Composer to install the Ray extension. 2. Configure Ray: Configure Ray in the PHP script, including enabling and customizing session IDs (optional). 3. Use Ray to debug functions: Use the Ray::wrap() method to wrap the function to be debugged. 4. Interactive debugging: View function call stacks, inspect variable values, run code snippets, and modify variables in RayUI's "Trace" tab.
2024-04-23
comment 0
782

Improved &#printf&# debugging
Article Introduction:One of the most common debugging techniques, 'printf' debugging is particularly popular because most people learn it intuitively when writing their first programs.
The 'printf' debugging is very accessible because
2024-08-21
comment 0
999

The Pitfalls of Recursion in C++ Debugging: Understanding the Call Stack and Debugging Techniques
Article Introduction:Pitfalls of recursion in C++: Stack overflow: Recursive calls may cause insufficient stack capacity. Use a debugger to trace the call stack and optimize the recursive algorithm. Infinite recursion: There is an error or omission in the recursive base case, resulting in continuous calls to itself, checking the recursive base case and using the memo optimization algorithm. Forked debugging: Recursion in multi-threads may result in incomplete debugging information. Use a concurrent debugger or optimization algorithm to ensure multi-thread safety.
2024-05-03
comment 0
978

How to debug PHP functions?
Article Introduction:How to debug PHP functions? Install and configure the XDebug debugger. Set up the IDE to use XDebug. Set breakpoints in your code. Start a debugging session to execute code line by line. Check variable values and continue debugging to find errors and resolve problems.
2024-04-18
comment 0
437

Debugging and testing of PHP functions
Article Introduction:PHP Function Debugging and Testing Guide: Configure Xdebug for advanced debugging capabilities. Use var_dump() and print_r() to check variable values. Use conditional breakpoints and breakpoints to control the flow of execution. Write unit tests to automate functional checks.
2024-04-13
comment 0
728

