Found a total of 9633 related content

vscode怎么调试
Article Introduction:如何在 VSCode 中调试代码?配置调试器,选择 "Node.js"。设置断点,在代码行号左侧单击空白区域。开始调试,按 F5 或点击 "调试" > "开始调试"。使用调试工具,包括断点管理器、调用堆栈、本地变量和监视表达式。使用调试提示,输出调试信息、修改代码和单步调试。
2024-05-27
comment
193

How to implement debugging and error debugging in PHP?
Article Introduction:In PHP, debugging and error debugging are an integral part of the development process. Debugging and error debugging can help developers quickly identify and resolve errors in applications, thereby improving application stability and reliability. This article will introduce how to implement debugging and error debugging in PHP. 1. Error debugging In PHP applications, errors may occur anywhere. In order to ensure the normal operation of the application, developers need to find and fix all errors in a timely manner. Here are some ways to implement error debugging: Logging
2023-05-12
comment 0
650
How to debug functions using Golang debugger?
Article Introduction:Using the dlv debugger, you can debug functions by following these steps: Install dlv Set breakpoints (dlvbreakfuncName) Start debugger (dlvdebug) Run program (dlvcontinue) Check variables (dlvprintvarName) Step into execution (dlvnext) Continue execution (dlvcont)
2024-04-17
comment
536
Remote debugging in PHP and its debugging tools
Article Introduction:With the development of Internet technology and the continuous growth of the PHP language, more and more Web applications have been produced. However, due to the nature of web applications, debugging PHP becomes more difficult. Especially when the PHP program is running on a remote server, you may encounter more problems. In order to solve these problems, developers need to understand remote debugging technology in PHP and its related debugging tools. 1. Remote debugging technology debugging process Before understanding the remote debugging technology in PHP, we need to understand what is going to be done
2023-06-22
comment 0
1005
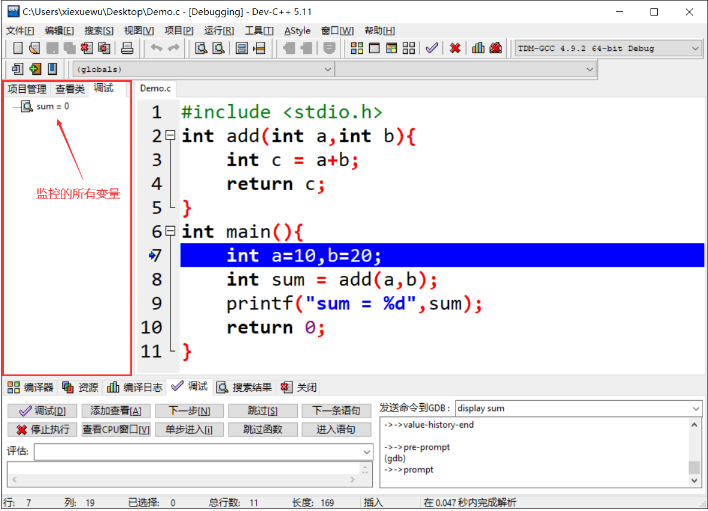
How to debug dev c? -dev c Chinese debugging
Article Introduction:Use and debugging of devc: 1. Use breakpoint debugging if it cannot be debugged: Tools –> Compile options –> Code generation/optimization –> Connector –> Generate debugging information –> Change no to yes. Basic steps for debugging; 1. Change the release mode in the upper right corner to debug mode 2. Set breakpoints 3. Click Compile All and click the check mark (a blue arrow indicates that the statement has not been executed yet and is about to be executed, but there are more than one blue line) , variables can be viewed in two ways after debugging, ① Add View to enter the variable value and view ② Select the variable or expression and click Add View to see the variable value in the left column) Of course, through the terminal The console can also observe the value of variables
2024-03-18
comment 0
222
JavaScript debugging console.table()
Article Introduction:Yesterday I learned about a small debugging method of the Chrome debugging tool. During WDCC, [Marcus Ross (@zahlenhelfer)] introduced various debugging methods of the Chrome debugging tool. This is just one of them. Now I will show it to you.
2020-07-06
comment 0
2433

How to debug javascript
Article Introduction:Methods for debugging JavaScript: 1. Use the [console.log()] method to print the JavaScript value on the debugging window; 2. Use the debugger keyword to stop executing JavaScript and call the debugging function.
2021-04-08
comment 1
2365
eclipse如何调试
Article Introduction:Eclipse 中调试代码指南:设置断点以暂停执行。启动调试器:菜单栏(“运行”>“调试”)、快捷键(F11)、工具栏(“调试”按钮)。使用单步执行命令逐步执行代码(逐语句、逐步骤、逐入、逐出)。查看变量值:悬停变量或在“变量”视图中找到。修改变量值:右键单击变量并选择“更改值”。单击“停止调试”按钮或按 F2 终止调试。
2024-06-09
comment
187
php如何调试
Article Introduction:PHP 提供多种调试工具,包括:print_r()、var_dump():打印变量内容error_log():记录错误和警告信息die():终止脚本执行xdebug 扩展:提供高级调试功能集成开发环境中的调试器:图形化界面调试代码
2024-06-02
comment 0
456
pycharm debugging tutorial
Article Introduction:The pycharm debugging tutorial is as follows: 1. Preparation; 2. Run the code; 3. Enter Run/Debug mode; 4. Save run/debug configuration information; 5. Official operation; 6. Run the test program; 7. Select a tester; 8. Create a test program block; 9. Run the test code; 10. Debug the run; 11. Breakpoints; 12. Set breakpoints; 13. Code debugging; 14. Run again; 15. REPL, debug the program in the console interface.
2023-12-19
comment 0
803

How to use PHP and Phalcon debugging tools for program debugging
Article Introduction:As a language widely used in web development, PHP provides developers with a variety of debugging tools for program debugging. Among the many debugging tools, the one built into the Phalcon framework has obvious advantages. It can help developers quickly locate and solve problems in the program. This article will introduce how to use PHP and Phalcon debugging tools for program debugging. 1. PHP debugging tools There are many debugging tools for the PHP language. The following are some of the commonly used ones. XdebugXdebug is done in PHP
2023-05-11
comment 0
712
Debugging in C++ technology: Custom debugger integration and extension
Article Introduction:C++ debugging techniques can be enhanced through custom debugger integration and extension, including the following steps: Integrate a custom debugger: Create an adapter, load it into the application, configure the debugger to use it. Extended Debugger: Add custom commands and functionality through the extension mechanism to meet specific debugging needs. In actual combat, debugger extensions are used to create visual tools to help debug objects in the game world and improve debugging efficiency of complex game states.
2024-05-09
comment
961

How to debug Golang functions using remote debugging?
Article Introduction:The steps to use remote debugging in Golang functions are as follows: Enable listening in the program: import_"net/http/pprof" Build and run the program: gorun-listen=0.0.0.0:1234main.go Set up the debugger in the IDE and connect to run program of. Set breakpoints. Run the debugger, attached to the running program.
2024-04-18
comment 0
987
Debugging and testing of golang functions
Article Introduction:There are three techniques for debugging and testing Go functions: using the debugger dlv to step through the code, inspect variables, and modify the code state. Test functions by writing test functions in the _test.go file and verifying the results using assertion functions. In actual combat, you can use dlv to debug the execution of the function, and use the test framework and assertion function to verify the correctness of the function.
2024-04-28
comment
902
How to fix: Java debugging error: Inaccurate debugging information
Article Introduction:How to solve: Java debugging error - debugging information is inaccurate Introduction: During the Java development process, you often encounter situations that require debugging. However, sometimes we find that the debugging information is inaccurate, which brings us some trouble in locating and solving the problem. This article will introduce several common cases of inaccurate debugging information and their solutions to help developers better troubleshoot and solve Java debugging problems. 1. NullPointException exception does not specify the specific location NullPointExc
2023-08-19
comment 0
1186
idea怎么debug调试
Article Introduction:如何调试 IntelliJ IDEA?IntelliJ IDEA 提供调试工具,可帮助识别和解决代码错误,具体步骤包括:设置断点以在特定代码行暂停调试器。启动调试器以开始调试过程。检查变量值并评估表达式。使用单步执行或跳入调试逐步检查代码执行情况。查看调用堆栈以跟踪函数调用顺序。设置观察值以监视变量的变化。调试远程代码,支持 Java、Kotlin 等多种语言。使用日志记录功能记录应用程序消息以辅助调试。利用附加工具进一步分析应用程序行为,如性能分析器和覆盖率工具。
2024-06-12
comment
896

How to debug sql in yii
Article Introduction:Methods for debugging SQL in Yii: 1. Use the system’s built-in debugging, and you need to enable debugging mode in index.php; 2. Use debugging tools to debug, unzip the yii-debug-toolbar tool and put it into extensions.
2020-06-12
comment 0
2535
How to use Ray to debug interactive debugging of PHP functions?
Article Introduction:How to debug PHP functions with Ray? 1. Install Ray: Use Composer to install the Ray extension. 2. Configure Ray: Configure Ray in the PHP script, including enabling and customizing session IDs (optional). 3. Use Ray to debug functions: Use the Ray::wrap() method to wrap the function to be debugged. 4. Interactive debugging: View function call stacks, inspect variable values, run code snippets, and modify variables in RayUI's "Trace" tab.
2024-04-23
comment
485

How to debug vc++6.0?
Article Introduction:Debugging method: 1. Open vc++ and press F5 to enter debugging mode; 2. Click on a blank space in the toolbar and select "Debug"; 3. Add variables to monitor data changes in the monitoring window; 4. Press F11 to debug the code statement by statement. That’s it.
2020-06-24
comment 0
6513
The Pitfalls of Recursion in C++ Debugging: Understanding the Call Stack and Debugging Techniques
Article Introduction:Pitfalls of recursion in C++: Stack overflow: Recursive calls may cause insufficient stack capacity. Use a debugger to trace the call stack and optimize the recursive algorithm. Infinite recursion: There is an error or omission in the recursive base case, resulting in continuous calls to itself, checking the recursive base case and using the memo optimization algorithm. Forked debugging: Recursion in multi-threads may result in incomplete debugging information. Use a concurrent debugger or optimization algorithm to ensure multi-thread safety.
2024-05-03
comment
763
