Found a total of 2864 related content
PHP debugging tips: How to use the var_dump function to print the type and value of a variable
Article Introduction:PHP debugging tips: How to use the var_dump function to print the type and value of a variable Introduction: During code development and debugging, you often encounter situations where you need to view the type and value of a variable. To facilitate debugging, PHP provides the var_dump() function, which can print out the type and value of variables. This article will introduce the usage of var_dump() function and give some examples. 1. Basic usage of var_dump() function The var_dump() function is a function provided by PHP for debugging.
2023-08-01
comment 0
820
Explore variable handling techniques in Linux debuggers!
Article Introduction:The guided variable is sneaky. Sometimes they'll happily sit in the register, only to end up on the stack as soon as they turn around. For optimization purposes, the compiler may throw them out of the window entirely. No matter how variables move through memory, we need some way to track and manipulate them in the debugger. This article will teach you how to handle variables in the debugger and demonstrate a simple implementation using libelfin. Series of articles index preparation environment breakpoint register and memory ELF and DWARF source code and signal source code level step by step execution of source code level breakpoint stack expansion processing variables advanced topics Before starting, please make sure that the version of libelfin you are using is fbreg on my branch. This contains some hacks to support getting the current heap
2024-01-15
comment 0
397

eclipse如何调试
Article Introduction:Eclipse 中调试代码指南:设置断点以暂停执行。启动调试器:菜单栏(“运行”>“调试”)、快捷键(F11)、工具栏(“调试”按钮)。使用单步执行命令逐步执行代码(逐语句、逐步骤、逐入、逐出)。查看变量值:悬停变量或在“变量”视图中找到。修改变量值:右键单击变量并选择“更改值”。单击“停止调试”按钮或按 F2 终止调试。
2024-06-09
comment
187
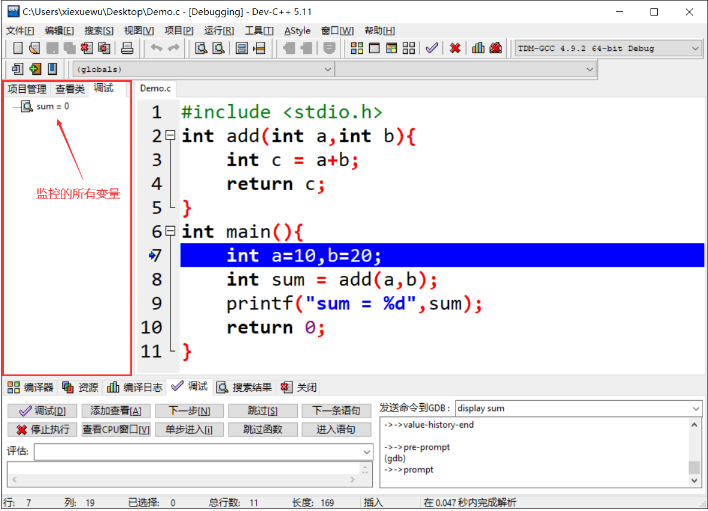
How to debug dev c? -dev c Chinese debugging
Article Introduction:Use and debugging of devc: 1. Use breakpoint debugging if it cannot be debugged: Tools –> Compile options –> Code generation/optimization –> Connector –> Generate debugging information –> Change no to yes. Basic steps for debugging; 1. Change the release mode in the upper right corner to debug mode 2. Set breakpoints 3. Click Compile All and click the check mark (a blue arrow indicates that the statement has not been executed yet and is about to be executed, but there are more than one blue line) , variables can be viewed in two ways after debugging, ① Add View to enter the variable value and view ② Select the variable or expression and click Add View to see the variable value in the left column) Of course, through the terminal The console can also observe the value of variables
2024-03-18
comment 0
222

How to call variables in java
Article Introduction:How to call variables in Java: 1. Use new to create a variable in the class, and then call the variable by calling a public variable in the class. 2. Define the variable as a static public variable, and then obtain it directly using the class name.variable name. 3. Use methods or interfaces to pass this variable from other classes.
2019-12-27
comment 0
4281

python怎么调用变量
Article Introduction:在 Python 中,通过变量名调用变量。定义变量:使用赋值运算符分配值(x = 5)。调用变量:使用变量名直接获取值(print(x))。注意:变量必须已定义,并遵循 Python 标识符规则。
2024-06-01
comment
241
What should I do if I can't see the real-time variable values when debugging JS code in vs2010?
Article Introduction:In daily development, we often use JavaScript to implement some front-end logic processing, and Visual Studio 2010, as a powerful development tool, can also support JavaScript debugging functions. But sometimes we encounter the problem that we cannot see the real-time variable values when debugging JavaScript, which causes great trouble for us to debug and locate problems. In this article, we will discuss the causes of this problem and how to solve it. question
2023-04-24
comment 0
671

How to debug functions using Golang debugger?
Article Introduction:Using the dlv debugger, you can debug functions by following these steps: Install dlv Set breakpoints (dlvbreakfuncName) Start debugger (dlvdebug) Run program (dlvcontinue) Check variables (dlvprintvarName) Step into execution (dlvnext) Continue execution (dlvcont)
2024-04-17
comment
536

How to debug vc++6.0?
Article Introduction:Debugging method: 1. Open vc++ and press F5 to enter debugging mode; 2. Click on a blank space in the toolbar and select "Debug"; 3. Add variables to monitor data changes in the monitoring window; 4. Press F11 to debug the code statement by statement. That’s it.
2020-06-24
comment 0
6513

How to use Ray to debug interactive debugging of PHP functions?
Article Introduction:How to debug PHP functions with Ray? 1. Install Ray: Use Composer to install the Ray extension. 2. Configure Ray: Configure Ray in the PHP script, including enabling and customizing session IDs (optional). 3. Use Ray to debug functions: Use the Ray::wrap() method to wrap the function to be debugged. 4. Interactive debugging: View function call stacks, inspect variable values, run code snippets, and modify variables in RayUI's "Trace" tab.
2024-04-23
comment
485

How to debug codeblocks?
Article Introduction:The CodeBlocks debugger requires a complete project to start. First set the breakpoint, then start the debugger; finally open the debugging window in the toolbar, mainly open Watches. Watches displays the values of the current variables. In addition to the automatically displayed values, you can also manually add variables that need to be observed.
2020-04-16
comment 0
7791

How to debug breakpoints in pycharm
Article Introduction:Perform breakpoint debugging in PyCharm, including: opening the debugging toolbar; setting breakpoints (click the blank line number area on the left); starting debugging (debugger drop-down menu); executing code step by step (Step Over, Step Into, Step Out ); View variables and expressions (hover or enter the debugger variables pane); Continue debugging (Continue button or F9); Remove breakpoints (click the red dot or use the Remove All Breakpoints button).
2024-04-18
comment 0
1002
Xdebug, your PHP debugging savior: enter a new world of debugging with one click
Article Introduction:Step-by-Step Debugging The most notable feature of Xdebug is its step-by-step debugging mode. It allows you to execute scripts at a controlled speed, pause the code when needed and check variable status. This is crucial for understanding complex code logic and finding errors. Checking variable values Xdebug allows you to check the value of variables at runtime. You can use the Variable Viewer to inspect individual variables or use the Context Viewer to view all visible variables in a function or method call. This helps quickly identify errors or understand data flow. Analyze code performance Xdebug provides the function of analyzing code performance. It can create function trace files, showing the execution time and calling relationship of each function. This helps optimize code and identify bottlenecks. Remote debuggingXdebug supports remote debugging,
2024-03-16
comment 0
588
Detailed explanation of C++ function debugging: How to use the debugger to locate problems?
Article Introduction:Using a debugger to locate problems is the key to debugging C++ functions. The specific steps are: Set breakpoints to pause execution. Step through code to view variable values line by line. Check the variable to see the value and type. Use a call stack to display a sequence of function calls. By following these steps, you can effectively debug functions, identify errors, and improve code quality.
2024-05-01
comment 0
265

vscode怎么调试
Article Introduction:如何在 VSCode 中调试代码?配置调试器,选择 "Node.js"。设置断点,在代码行号左侧单击空白区域。开始调试,按 F5 或点击 "调试" > "开始调试"。使用调试工具,包括断点管理器、调用堆栈、本地变量和监视表达式。使用调试提示,输出调试信息、修改代码和单步调试。
2024-05-27
comment
193

idea怎么debug调试
Article Introduction:如何调试 IntelliJ IDEA?IntelliJ IDEA 提供调试工具,可帮助识别和解决代码错误,具体步骤包括:设置断点以在特定代码行暂停调试器。启动调试器以开始调试过程。检查变量值并评估表达式。使用单步执行或跳入调试逐步检查代码执行情况。查看调用堆栈以跟踪函数调用顺序。设置观察值以监视变量的变化。调试远程代码,支持 Java、Kotlin 等多种语言。使用日志记录功能记录应用程序消息以辅助调试。利用附加工具进一步分析应用程序行为,如性能分析器和覆盖率工具。
2024-06-12
comment
896

What is the role of closures in testing and debugging?
Article Introduction:The functions of closures in testing and debugging include: isolating tests and preventing external variables from affecting the results. Debug hard-to-reach variables and maintain access and modification of variables. Cache data to improve program performance.
2024-04-25
comment
530

php如何调试
Article Introduction:PHP 提供多种调试工具,包括:print_r()、var_dump():打印变量内容error_log():记录错误和警告信息die():终止脚本执行xdebug 扩展:提供高级调试功能集成开发环境中的调试器:图形化界面调试代码
2024-06-02
comment 0
456

怎么调试php代码
Article Introduction:调试 PHP 代码有助于发现和修复错误,使应用程序更健壮。方法包括:使用 Xdebug 进行广泛调试。使用 var_dump() 和 print_r() 查看变量值。使用错误日志记录错误和警告。利用 PHPStorm IDE 进行断点设置和变量检查。使用命令行工具设置断点和执行调试操作。在 Docker 容器中使用 docker exec 进行调试。遵循提示,例如使用清晰的变量名、异常处理和单元测试。
2024-05-25
comment 0
123
The power of Xdebug, the secret weapon of PHP debugging: let you get twice the result with half the effort
Article Introduction:Xdebug is a widely used PHP debugger that provides developers with a range of powerful tools to gain insight into their code execution. By integrating with the PHP engine, Xdebug allows developers to set breakpoints anywhere in the code, inspect variables and stack traces, and catch and analyze exceptions. Powerful features of Xdebug 1. Real-time debugging: Xdebug’s real-time debugging capabilities enable developers to pause the script while the code is executing and execute it line by line. This allows them to inspect variable values, modify variables, call functions, and gain insight into the code flow to quickly find and fix errors. 2. Remote debugging: Xdebug supports remote debugging, allowing developers to connect to the remote server from the local machine and debug the correct
2024-03-16
comment 0
167
