Found a total of 10000 related content
echarts relationship diagram unicode encoding phpsql 20160621 review
Article Introduction:: echarts relationship diagram unicode encoding phpsql 20160621 review: 1. I have been studying how to make echarts relationship diagram in the morning. echarts has two official websites, one is echarts3 and the other is echarts2. I have been using echarts3, and there are several complicated examples in it. It is to call an xml. This xml is a famous relationship diagram (only draw relationship diagrams?). The software Gephi exports the format gexf. The first idea was to dynamically generate this xml. Later, I found it a bit complicated, and then I looked at a few more A simple example, combined with the documentation, shows that it can be written directly in json format, involving
2016-07-28
comment 0
1011

How to import echarts map into vue
Article Introduction:Import method: 1. Use the "npm install echarts -S" command to install echarts dependencies; 2. Globally introduce echarts in "main.js"; 3. Use the import statement to introduce the "china.js" file in pages that require maps. Just add relevant code.
2021-10-27
comment 0
4617

ECharts scatter plot (multidimensional): how to display data relationships and distribution
Article Introduction:ECharts Scatter Chart (Multi-dimensional): How to display data relationships and distribution, specific code examples are required. Introduction: In the field of data visualization, scatter chart is a commonly used chart type, which can display the relationship between different dimensions and the distribution of data. Distribution. As a powerful and flexible visualization library, ECharts provides a wealth of functions and configuration options that can be used to create various types of scatter plots. This article will introduce how to use ECharts to create scatter plots and give specific code examples. Prepare the data: First,
2023-12-17
comment 0
870

Report import and data correlation skills for Vue statistical charts
Article Introduction:Report import and data correlation skills for Vue statistical charts Introduction: Vue, as a popular front-end framework, is widely used in various web applications. In web applications, statistical charts are one of the most common ways to display data. This article will introduce how to import the statistical chart library in Vue, and show how to achieve dynamic updating of charts through data association techniques. 1. Selection and import of report libraries In Vue, there are many excellent statistical chart libraries to choose from, such as ECharts and HighCharts.
2023-08-18
comment 0
1039

How to import and export statistical chart data through ECharts and php interfaces
Article Introduction:How to import and export statistical chart data through ECharts and PHP interfaces. In modern data visualization, statistical charts are a very important way to visually display the trends and relationships of data. ECharts is a very powerful front-end data visualization library that can provide rich chart types and interactive functions. This article will introduce how to use ECharts and PHP interfaces to implement data import and export of statistical charts. 1. Data import: Import data into ECharts
2023-12-17
comment 0
1425

From beginner to proficient: Use ECharts and golang to create practical statistical charts
Article Introduction:From entry to mastery: Use ECharts and golang to create practical statistical charts Introduction: In the modern data-driven era, statistical charts are one of the important tools for us to understand and display data. With statistical charts, we can more intuitively observe the trends, distributions and relationships of data. This article will introduce how to use ECharts and golang, two powerful tools, to create practical statistical charts, and will provide specific code examples. 1. Introduction to ECharts Overview of ECharts ECharts is
2023-12-18
comment 0
884
How to use Sankey diagram to show data flow in ECharts
Article Introduction:How to use Sankey diagram to display data flow in ECharts Introduction: Data visualization is an important part of data analysis, which can visually display complex data through charts and other methods. ECharts is a powerful data visualization library that supports a variety of chart types. Among them, Sankey Diagram can display the flow relationship of data very intuitively. This article will introduce how to use Sankey diagrams to display data flow in ECharts and provide specific code examples. Introducing EChar
2023-12-17
comment 0
1631

ECharts Radar Chart: How to Display Multidimensional Data
Article Introduction:ECharts Radar Chart: How to display multi-dimensional data requires specific code examples Introduction: In the field of data visualization, radar chart is a commonly used chart type used to display the distribution and comparison relationship of multi-dimensional data. As a powerful open source data visualization library, ECharts provides a variety of chart types, including radar charts. This article will introduce how to use ECharts to draw radar charts and give corresponding code examples. 1. Introduction to Radar Charts Radar charts, also known as spider web charts or star charts, use multiple concentric circles and
2023-12-17
comment 0
1433

Jia Qianghuai: Construction and application of large-scale knowledge graph of ants
Article Introduction:1. Graph Overview First introduce some basic concepts of knowledge graph. 1. What is knowledge graph? Knowledge graph aims to use graph structures to model, identify and infer complex relationships between things and precipitate domain knowledge. It is an important cornerstone of realizing cognitive intelligence and has been widely used in search engines and intelligent question answering. , language semantic understanding, big data decision analysis and many other fields. The knowledge graph models both the semantic relationship and the structural relationship between data. Combined with deep learning technology, the two relationships can be better integrated and represented. 2. Why should we build a knowledge graph? We want to build a knowledge graph mainly from the following two points: on the one hand, the characteristics of the data source background of ants themselves, and on the other hand, the benefits that the knowledge graph can bring. [1] The data sources themselves are diverse and heterogeneous.
2023-09-10
comment 0
1224

Five major trends in semantic AI and data management
Article Introduction:1. Graph databases and knowledge graphs will become the dominant force in 2022. Many people predict that graph databases will become the secret weapon in 2022. Carl Olofson, research vice president at IDC, expects graph database usage to grow 600% over the next 10 years, starting this year. In an article written by analyst Dave Vellante, a summary of how to take advantage of a typical relational database’s uses and limitations: “With a relational database, you can [find relationships and see how many levels there are in the chain], but this It requires a lot of programming. In fact, you can do almost any of the above using a relational database, but the problem is, you have to program it. Whenever you have to program it, it means you can't track it, you can't determine it.
2023-04-12
comment 0
1081

Mastering Neowith Java: Setup, Queries, Transactions, and Visualization
Article Introduction:Neo4j is a powerful graph database that excels at managing highly connected data. When combined with Java, it provides a robust solution for building applications that require complex relationship modeling. This post will walk you through the basics
2024-08-28
comment 0
605

How to use Vue and jsmind to implement node style customization and skin switching of mind maps?
Article Introduction:How to use Vue and jsmind to implement node style customization and skin switching of mind maps? Mind map is a commonly used thinking tool that can help us organize our thoughts, record our thinking process and show relationships. Vue.js is a popular front-end framework, and jsmind is a mind mapping plug-in based on Vue. It provides a rich API that can easily customize node styles and implement skin switching. First, we need to install and introduce jsmind and Vue.js. You can use jsmin
2023-08-27
comment 0
1322

Learn to use ECharts and golang to create stunning statistical charts tutorial
Article Introduction:Learn to use ECharts and golang to create stunning statistical charts. In the modern Internet era, data visualization is one of the important means to attract users and display information. As a form of data visualization, statistical charts can clearly and intuitively display the trends and relationships of data. This article will teach you how to use ECharts and golang to create stunning statistical charts, with specific code examples. (1) Introduction to ECharts ECharts is a Java-based software developed by Baidu front-end team.
2023-12-18
comment 0
1291

Learning and thinking about graph computing
Article Introduction:Good software is not discovered by program analysis and error detection, but is built by the right people. Graphs have become an increasingly important computing object. The graph structure is an abstraction of group relationships and can describe rich objects and relationships. The core of graph computing is how to model data into a graph structure and how to transform the solution of the problem into a computing problem on the graph structure. When the problem involves correlation analysis, graph computing can often make the solution to the problem naturally expressed as a A series of operations and calculations on graph structures. For example, the PageRank algorithm based on the graph structure of web page links is used to obtain the weight of the web page, which is used as a reference for search engine ranking. The user behavior data of the graph structure is used to obtain accurate group preference analysis and personalized product recommendation results. 1.What is plotting?
2023-04-11
comment 0
1153

Set up mongodb on Linux operating system
Article Introduction:Introduction MongoDB is a product between a relational database and a non-relational database. It is the most feature-rich among non-relational databases and is most like a relational database. The data structure it supports is very loose and is a bson format similar to json, so it can store more complex data types. The biggest feature of Mongo is that the query language it supports is very powerful. Its syntax is somewhat similar to an object-oriented query language. It can almost implement most functions similar to single-table queries in relational databases, and it also supports indexing of data. 1. Download the Linux installation package as shown below and place it in a local corner. Remember the location~ 2. Connect to your server sshroot@your IP//Enter and enter the password 3. Upload the installation package to another
2023-12-30
comment 0
1256

Knowledge graph and data connectivity based on Elasticsearch in PHP
Article Introduction:The knowledge graph based on Elasticsearch in PHP is connected to the data and requires specific code examples. The knowledge graph is a graphical model used to describe knowledge structures and relationships. It represents the relationship between entities through the connection of nodes and edges. Elasticsearch is an open source-based full-text search engine that can quickly process large amounts of data and provide powerful search and analysis capabilities. This article will introduce how to use PHP to build Elasticsearch-based
2023-10-03
comment 0
1070

How to use ECharts and Java interfaces to implement various types of statistical charts
Article Introduction:How to use ECharts and Java interfaces to implement various types of statistical charts. With the advent of the big data era, data analysis and visualization have become important tools and technologies. Statistical charts are one of the common forms of data visualization, which can visually display the distribution, trend, correlation and other information of data. ECharts is an open source chart library based on JavaScript, with powerful data visualization capabilities and rich chart types. As a programming language widely used in back-end development, Java also has many mature
2023-12-18
comment 0
637
How does graph intelligence move toward general artificial intelligence? This study at the Bund Conference has useful information
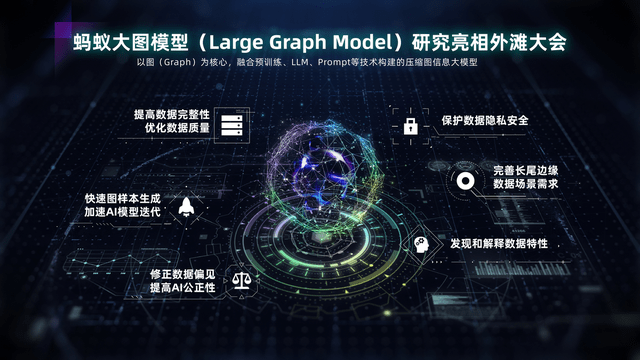
Article Introduction:“Generative artificial intelligence is the most important technological revolution in the past 40 years.” This is the latest judgment of Microsoft co-founder Bill Gates. When intelligence emerges, how to promote scientific research and application innovation has become the focus of the industry. On September 7, at the "New Generation Data Base - Exploring the Application and Development of Graph Intelligence" sub-forum at the 2023 Bund Conference, Ant Group presented a fusion research - "Large Graph Model" (Large Graph Model, referred to as LGM). This research combines graph computing with graph learning and large language models, using the generation capabilities of large language models and the correlation analysis capabilities of graph computing to provide more intuitive and comprehensive information presentation and more accurate insights, thereby better Solve massive and complex digital application problems. at present
2023-09-10
comment 0
1246
GraphRAG enhanced for knowledge graph retrieval (implemented based on Neo4j code)
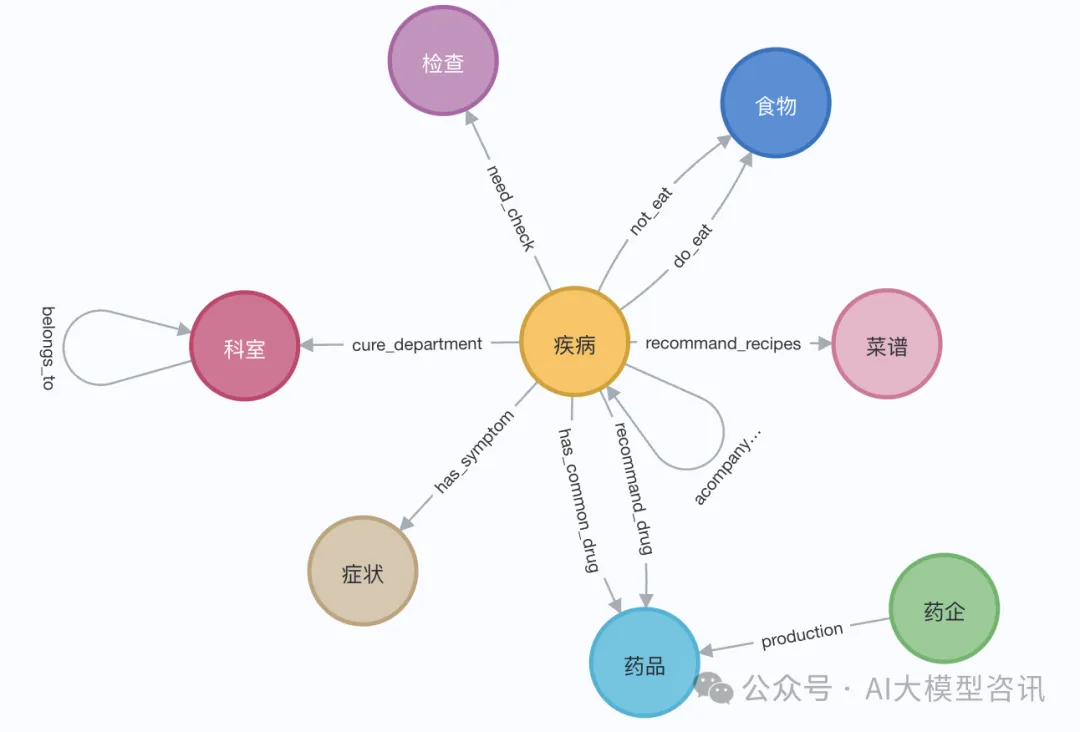
Article Introduction:Graph Retrieval Enhanced Generation (GraphRAG) is gradually becoming popular and has become a powerful complement to traditional vector search methods. This method takes advantage of the structural characteristics of graph databases to organize data in the form of nodes and relationships, thereby enhancing the depth and contextual relevance of retrieved information. Graphs have natural advantages in representing and storing diverse and interrelated information, and can easily capture complex relationships and properties between different data types. Vector databases are unable to handle this type of structured information, and they focus more on processing unstructured data represented by high-dimensional vectors. In RAG applications, combining structured graph data and unstructured text vector search allows us to enjoy the advantages of both at the same time, which is what this article will discuss. structure
2024-06-12
comment 0
1138

Implementation of radar chart and heat flow chart functions of Vue statistical chart
Article Introduction:Implementation of Radar Chart and Heat Flow Chart Function of Vue Statistical Chart Introduction: With the increasing importance of data visualization in business scenarios, statistical charts have become one of the common component requirements in web development. This article will introduce how to implement the functions of radar chart and heat flow chart in Vue project. Through sample code, readers can quickly master how to use related chart components. 1. Implementation of Radar Chart Function Radar chart is a graph that can display data in multiple dimensions. In the Vue project, we can use ECharts to implement radar charts
2023-08-25
comment 0
1443


