大概就像下图所示的样子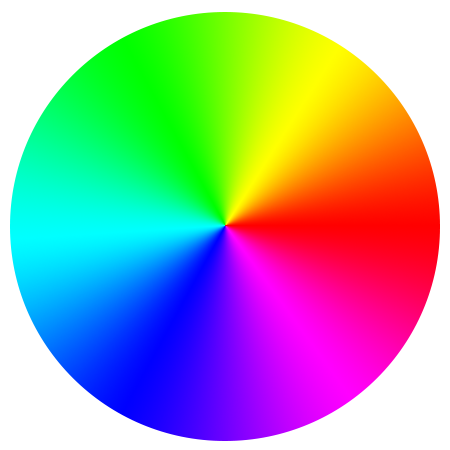
t = (0:.02:2)*pi;
r = 0:.02:1;
pcolor(cos(t)'*r,sin(t)'*r,t'*(r==r))
colormap(hsv(256)), shading interp, axis image off
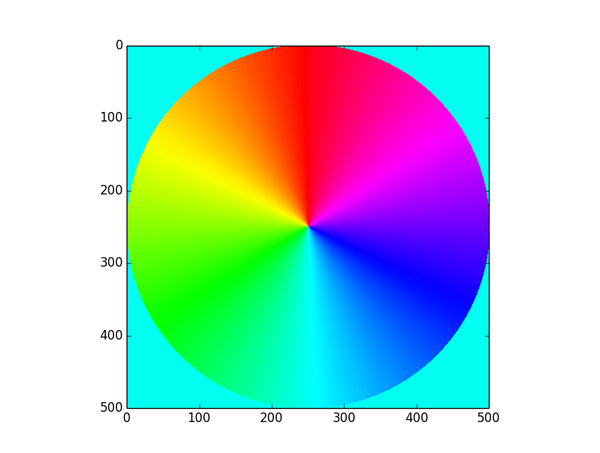

# -*- coding:utf-8 -*-
from pylab import *

center = (250, 250)
radius = 250

img = zeros((500,500))

for i in range(500):
    for j in range(500):
        x = i - center[0] * 1.0
        y = j - center[1] * 1.0
        if x**2+y**2  radius**2:
            if x > 0:
                img[i,j] = arctan(y/x)
            elif x0 and y>=0:
                img[i,j] = arctan(y/x) + pi
            elif x0 and y0:
                img[i,j] = arctan(y/x) - pi
            elif x==0 and y>0:
                img[i,j] = pi / 2
            elif x==0 and y0:
                img[i,j] = pi / -2
            elif x==0 and y==0:
                img[i,j] = 0.0

print img
imshow(img, cmap=cm.hsv)
show()
from pylab import *
n=300
img=[[arctan2(x,y) if x*x+y*yn*n else 0 for y in range(-n,n)] for x in range(-n,n)]
imshow(img, cmap=cm.hsv)
show()
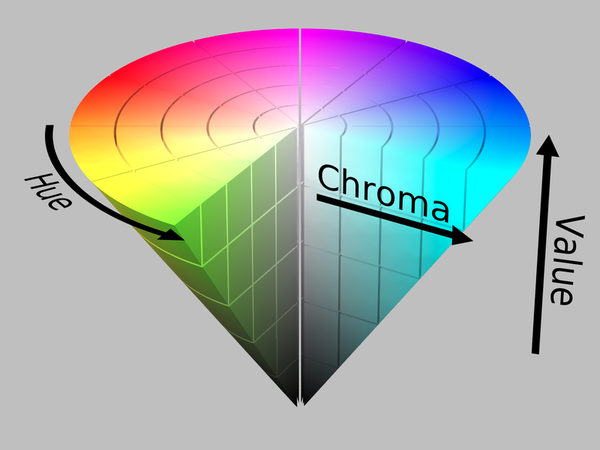 只不过明度Chroma没有变化。
n=300;
c=Hue[i/n];
Graphics@Table[{c,EdgeForm@c,Disk[{0,0},1,2Pi/n{i-1,i}]},{i,n}]


Copyright 2014-2023 //m.sbmmt.com/ All Rights Reserved | 苏州跃动光标网络科技有限公司 | 苏ICP备2020058653号-1
| 本站CDN由 数掘科技 提供


 0
0 0
0 134
134


![ThinkPHP5实战之[教学管理系统]](https://img.php.cn/upload/course/000/000/068/6253d87459486427.png)