


这篇文章主要介绍了使用Python导出Excel图表以及导出为图片的方法,Python相关模块在Windows下操作office非常方便,需要的朋友可以参考下
本篇讲下如何使用纯python代码将excel 中的图表导出为图片。这里需要使用的模块有win32com、pythoncom模块。
网上经查询有人已经写好的模块pyxlchart,具体代码如下:
from win32com.client import Dispatch
import os
import pythoncom
class Pyxlchart(object):
 """
 This class exports charts in an Excel Spreadsheet to the FileSystem
 win32com libraries are required.
 """
 def __init__(self):
  pythoncom.CoInitialize()
  self.WorkbookDirectory = ''
  self.WorkbookFilename = ''
  self.GetAllWorkbooks = False
  self.SheetName = ''
  self.ChartName = ''
  self.GetAllWorkbookCharts = False
  self.GetAllWorksheetCharts = False
  self.ExportPath = ''
  self.ImageFilename = ''
  self.ReplaceWhiteSpaceChar = '_'
  self.ImageType = 'jpg'
 def __del__(self):
  pass
 def start_export(self):
  if self.WorkbookDirectory == '':
   return "WorkbookDirectory not set"
  else:
   self._export()
 def _export(self):
  """
  Exports Charts as determined by the settings in class variabels.
  """
  excel = Dispatch("excel.application")
  excel.Visible = False
  wb = excel.Workbooks.Open(os.path.join(self.WorkbookDirectory ,self.WorkbookFilename))
  self._get_Charts_In_Worksheet(wb,self.SheetName,self.ChartName)
  wb.Close(False)
  excel.Quit()
 def _get_Charts_In_Worksheet(self,wb,worksheet = "", chartname = ""):
  if worksheet != "" and chartname != "":
   sht = self._change_sheet(wb,worksheet)
   cht = sht.ChartObjects(chartname)
   self._save_chart(cht)
   return
  if worksheet == "":
   for sht in wb.Worksheets:
    for cht in sht.ChartObjects():
     if chartname == "":
      self._save_chart(cht)
     else:
      if chartname == cht.Name:
       self._save_chart(cht)
  else:
   sht = wb.Worksheets(worksheet)
   for cht in sht.ChartObjects():
    if chartname == "":
     self._save_chart(cht)
    else:
     if chartname == cht.Name:
      self._save_chart(cht)
 def _change_sheet(self,wb,worksheet):
  try:
   return wb.Worksheets(worksheet)
  except:
   raise NameError('Unable to Select Sheet: ' + worksheet + ' in Workbook: ' + wb.Name)
 def _save_chart(self,chartObject):
  imagename = self._get_filename(chartObject.Name)
  savepath = os.path.join(self.ExportPath,imagename)
  print savepath
  chartObject.Chart.Export(savepath,self.ImageType)
 def _get_filename(self,chartname):
  """
  Replaces white space in self.WorkbookFileName with the value given in self.ReplaceWhiteSpaceChar
  If self.ReplaceWhiteSpaceChar is an empty string then self.WorkBookFileName is left as is
  """
  if self.ImageFilename == '':
   self.ImageFilename == chartname
  if self.ReplaceWhiteSpaceChar != '':
   chartname.replace(' ',self.ReplaceWhiteSpaceChar)
  if self.ImageFilename != "":
   return self.ImageFilename + "_" + chartname + "." + self.ImageType
  else:
   return chartname + '.' + self.ImageType
if __name__ == "__main__":
 xl = Pyxlchart()
 xl.WorkbookDirectory = "\\\\maawtns01\\discipline\\procurement\\MATERIEL\\Raw Material\\Data Management\\Hawk"
 xl.WorkbookFilename = "Hawk Workability KPI.xlsm"
 xl.SheetName = ""
 xl.ImageFilename = "MyChart1"
 xl.ExportPath = "d:\\pycharts"
 xl.ChartName = ""
 xl.start_export()
 print "This file does not currently allow direct access"
 print "Please import PyXLChart and run start_export()"
这里还使用Excel vba将chart另存为图片篇中创建的chart_column.xlsx表,使用上面的模块的方法如下:
from pyxlchart import Pyxlchart
xl = Pyxlchart()
xl.WorkbookDirectory = "D:\\"
xl.WorkbookFilename = "chart_column.xlsx"
xl.SheetName = ""
#xl.ImageFilename = "MyChart1"
xl.ExportPath = "d:\\"
xl.ChartName = ""
xl.start_export()
由于有该表里有多张图表,所以上面未指定xl.ImageFilename ,使用示例如下:
Excel vba将chart另存为图片
python下使用xlswriter模块,可以轻松在excel 中创建图片,不过想实现将生成的chart图表导出为图片,在email 中导入图片的目标 。经网上查询未找到通过python代码将excel 中已经生成的图片导出为图片的方法,不过通过变通方法,使用excel 内的vba 宏却可以轻松将图片导出。
1、导出单张图片
python 创建chart图片代码:
#coding: utf-8
import xlsxwriter
import random
def get_num():
 return random.randrange(0, 201, 2)
workbook = xlsxwriter.Workbook('analyse_spider.xlsx') #创建一个Excel文件
worksheet = workbook.add_worksheet() #创建一个工作表对象
chart = workbook.add_chart({'type': 'column'}) #创建一个图表对象
#定义数据表头列表
title = [u'业务名称',u'星期一',u'星期二',u'星期三',u'星期四',u'星期五',u'星期六',u'星期日',u'平均流量']
buname= [u'运维之路',u'就要IT',u'baidu.com',u'361way.com',u'91it.org'] #定义频道名称
#定义5频道一周7天流量数据列表
data = []
for i in range(5):
 tmp = []
 for j in range(7):
  tmp.append(get_num())
 data.append(tmp)
format=workbook.add_format() #定义format格式对象
format.set_border(1) #定义format对象单元格边框加粗(1像素)的格式
format_title=workbook.add_format() #定义format_title格式对象
format_title.set_border(1) #定义format_title对象单元格边框加粗(1像素)的格式
format_title.set_bg_color('#cccccc') #定义format_title对象单元格背景颜色为
          #'#cccccc'的格式
format_title.set_align('center') #定义format_title对象单元格居中对齐的格式
format_title.set_bold() #定义format_title对象单元格内容加粗的格式
format_ave=workbook.add_format() #定义format_ave格式对象
format_ave.set_border(1) #定义format_ave对象单元格边框加粗(1像素)的格式
format_ave.set_num_format('0.00') #定义format_ave对象单元格数字类别显示格式
#下面分别以行或列写入方式将标题、业务名称、流量数据写入起初单元格,同时引用不同格式对象
worksheet.write_row('A1',title,format_title)
worksheet.write_column('A2', buname,format)
worksheet.write_row('B2', data[0],format)
worksheet.write_row('B3', data[1],format)
worksheet.write_row('B4', data[2],format)
worksheet.write_row('B5', data[3],format)
worksheet.write_row('B6', data[4],format)
#定义图表数据系列函数
def chart_series(cur_row):
 worksheet.write_formula('I'+cur_row, \
  '=AVERAGE(B'+cur_row+':H'+cur_row+')',format_ave) #计算(AVERAGE函数)频
               #道周平均流量
 chart.add_series({
  'categories': '=Sheet1!$B$1:$H$1', #将“星期一至星期日”作为图表数据标签(X轴)
  'values':  '=Sheet1!$B$'+cur_row+':$H$'+cur_row, #频道一周所有数据作
                #为数据区域
  'line':  {'color': 'black'}, #线条颜色定义为black(黑色)
  'name': '=Sheet1!$A$'+cur_row, #引用业务名称为图例项
 })
for row in range(2, 7): #数据域以第2~6行进行图表数据系列函数调用
 chart_series(str(row))
chart.set_size({'width': 577, 'height': 287}) #设置图表大小
chart.set_title ({'name': u'爬虫分析'}) #设置图表(上方)大标题
chart.set_y_axis({'name': 'count'}) #设置y轴(左侧)小标题
worksheet.insert_chart('A8', chart) #在A8单元格插入图表
workbook.close() #关闭Excel文档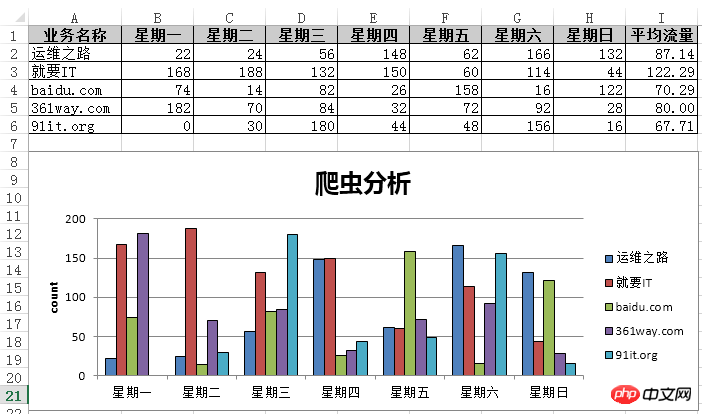
由于这里只有一张图片,通过vba 代码很容易生成图片 。方法为,打开该excel 图表,通过alt + F11 快捷键打开宏编辑界面;打开VB编辑器的立即窗口:”视图“-”立即窗口“,或者使用快捷键"Ctrl + G" ,接着输入如下代码
activesheet.ChartObjects(1).Chart.Export "C:\chart.png"
按 " Enter " 键后,会在C盘生成上面的生成的chart图表。
二、导出多张图表
python代码如下:
#coding: utf-8
import xlsxwriter
workbook = xlsxwriter.Workbook('chart_column.xlsx')
worksheet = workbook.add_worksheet()
bold = workbook.add_format({'bold': 1})
# 这是个数据table的列
headings = ['Number', 'Batch 1', 'Batch 2']
data = [
 [2, 3, 4, 5, 6, 7],
 [10, 40, 50, 20, 10, 50],
 [30, 60, 70, 50, 40, 30],
]
worksheet.write_row('A1', headings, bold)
worksheet.write_column('A2', data[0])
worksheet.write_column('B2', data[1])
worksheet.write_column('C2', data[2])
############################################
#创建一个图表,类型是column
chart1 = workbook.add_chart({'type': 'column'})
# 配置series,这个和前面wordsheet是有关系的。
chart1.add_series({
 'name':  '=Sheet1!$B$1',
 'categories': '=Sheet1!$A$2:$A$7',
 'values':  '=Sheet1!$B$2:$B$7',
})
# Configure a second series. Note use of alternative syntax to define ranges.
chart1.add_series({
 'name':  ['Sheet1', 0, 2],
 'categories': ['Sheet1', 1, 0, 6, 0],
 'values':  ['Sheet1', 1, 2, 6, 2],
})
# Add a chart title and some axis labels.
chart1.set_title ({'name': 'Results of sample analysis'})
chart1.set_x_axis({'name': 'Test number'})
chart1.set_y_axis({'name': 'Sample length (mm)'})
# Set an Excel chart style.
chart1.set_style(11)
# Insert the chart into the worksheet (with an offset).
worksheet.insert_chart('D2', chart1, {'x_offset': 25, 'y_offset': 10})
#######################################################################
#
# Create a stacked chart sub-type.
#
chart2 = workbook.add_chart({'type': 'column', 'subtype': 'stacked'})
# Configure the first series.
chart2.add_series({
 'name':  '=Sheet1!$B$1',
 'categories': '=Sheet1!$A$2:$A$7',
 'values':  '=Sheet1!$B$2:$B$7',
})
# Configure second series.
chart2.add_series({
 'name':  '=Sheet1!$C$1',
 'categories': '=Sheet1!$A$2:$A$7',
 'values':  '=Sheet1!$C$2:$C$7',
})
# Add a chart title and some axis labels.
chart2.set_title ({'name': 'Stacked Chart'})
chart2.set_x_axis({'name': 'Test number'})
chart2.set_y_axis({'name': 'Sample length (mm)'})
# Set an Excel chart style.
chart2.set_style(12)
# Insert the chart into the worksheet (with an offset).
worksheet.insert_chart('D18', chart2, {'x_offset': 25, 'y_offset': 10})
#######################################################################
#
# Create a percentage stacked chart sub-type.
#
chart3 = workbook.add_chart({'type': 'column', 'subtype': 'percent_stacked'})
# Configure the first series.
chart3.add_series({
 'name':  '=Sheet1!$B$1',
 'categories': '=Sheet1!$A$2:$A$7',
 'values':  '=Sheet1!$B$2:$B$7',
})
# Configure second series.
chart3.add_series({
 'name':  '=Sheet1!$C$1',
 'categories': '=Sheet1!$A$2:$A$7',
 'values':  '=Sheet1!$C$2:$C$7',
})
# Add a chart title and some axis labels.
chart3.set_title ({'name': 'Percent Stacked Chart'})
chart3.set_x_axis({'name': 'Test number'})
chart3.set_y_axis({'name': 'Sample length (mm)'})
# Set an Excel chart style.
chart3.set_style(13)
# Insert the chart into the worksheet (with an offset).
worksheet.insert_chart('D34', chart3, {'x_offset': 25, 'y_offset': 10})
workbook.close()同一数据源上面创建了三种类型的图 ,由于有三张图,上面的导出一张图的方法肯定是不行了,这里打开宏,创建如下宏内容:
Sub exportimg()
Dim XlsChart As ChartObject
For Each XlsChart In Worksheets("Sheet1").ChartObjects
 XlsChart.Chart.Export Filename:="C:\" & XlsChart.Name & ".jpg", FilterName:="JPG"
Next
End Sub该示例这里就不再截图,具体可以自行运行。
相关推荐:
使用Python将数组的元素导出到变量中(unpacking)
The above is the detailed content of How to export Excel charts and export them as pictures using Python. For more information, please follow other related articles on the PHP Chinese website!
 python development tools
 python packaged into executable file
 what python can do
 Compare the similarities and differences between two columns of data in excel
 excel duplicate item filter color
 How to use format in python
 How to copy an Excel table to make it the same size as the original
 Excel table slash divided into two


![[Web front-end] Node.js quick start](https://img.php.cn/upload/course/000/000/067/662b5d34ba7c0227.png)


