최근 Analysis with 프로그래밍에 Planet Python이 추가되었습니다. 저는 이 웹사이트의 첫 번째 게스트 블로거 중 한 명으로서 Python을 통해 데이터 분석을 시작하는 방법을 공유하려고 왔습니다. 구체적인 내용은 다음과 같습니다.
데이터 가져오기
로컬 또는 웹 CSV 파일 가져오기
데이터 변환
데이터 통계 설명
단일 표본 t -테스트;
시각화
사용자 정의 기능을 만듭니다.
import pandas as pd

# Reading data locally
df = pd.read_csv('/Users/al-ahmadgaidasaad/Documents/d.csv')

# Reading data from web
data_url = "https://raw.githubusercontent.com/alstat/Analysis-with-Programming/master/2014/Python/Numerical-Descriptions-of-the-Data/data.csv"
df = pd.read_csv(data_url)
# Head of the data
print df.head()

# OUTPUT
 Abra Apayao Benguet Ifugao Kalinga
0 1243 2934  148 3300 10553
1 4158 9235  4287 8063 35257
2 1787 1922  1955 1074  4544
3 17152 14501  3536 19607 31687
4 1266 2385  2530 3315  8520

# Tail of the data
print df.tail()

# OUTPUT
  Abra Apayao Benguet Ifugao Kalinga
74 2505 20878  3519 19737 16513
75 60303 40065  7062 19422 61808
76 6311 6756  3561 15910 23349
77 13345 38902  2583 11096 68663
78 2623 18264  3745 16787 16900
# Extracting column names
print df.columns

# OUTPUT
Index([u'Abra', u'Apayao', u'Benguet', u'Ifugao', u'Kalinga'], dtype='object')

# Extracting row names or the index
print df.index

# OUTPUT
Int64Index([0, 1, 2, 3, 4, 5, 6, 7, 8, 9, 10, 11, 12, 13, 14, 15, 16, 17, 18, 19, 20, 21, 22, 23, 24, 25, 26, 27, 28, 29, 30, 31, 32, 33, 34, 35, 36, 37, 38, 39, 40, 41, 42, 43, 44, 45, 46, 47, 48, 49, 50, 51, 52, 53, 54, 55, 56, 57, 58, 59, 60, 61, 62, 63, 64, 65, 66, 67, 68, 69, 70, 71, 72, 73, 74, 75, 76, 77, 78], dtype='int64')
# Transpose data
print df.T

# OUTPUT
   0  1  2  3  4  5  6  7  8  9
Abra  1243 4158 1787 17152 1266 5576 927 21540 1039 5424
Apayao 2934 9235 1922 14501 2385 7452 1099 17038 1382 10588
Benguet 148 4287 1955 3536 2530 771 2796 2463 2592 1064
Ifugao 3300 8063 1074 19607 3315 13134 5134 14226 6842 13828
Kalinga 10553 35257 4544 31687 8520 28252 3106 36238 4973 40140

   ...  69  70  71  72  73  74  75  76  77
Abra  ... 12763 2470 59094 6209 13316 2505 60303 6311 13345
Apayao ... 37625 19532 35126 6335 38613 20878 40065 6756 38902
Benguet ...  2354 4045 5987 3530 2585 3519 7062 3561 2583
Ifugao ...  9838 17125 18940 15560 7746 19737 19422 15910 11096
Kalinga ... 65782 15279 52437 24385 66148 16513 61808 23349 68663

   78
Abra  2623
Apayao 18264
Benguet 3745
Ifugao 16787
Kalinga 16900
print df.ix[:, 0].head()

# OUTPUT
0  1243
1  4158
2  1787
3 17152
4  1266
Name: Abra, dtype: int64
print df.ix[10:20, 0:3]

# OUTPUT
 Abra Apayao Benguet
10 981 1311  2560
11 27366 15093  3039
12 1100 1701  2382
13 7212 11001  1088
14 1048 1427  2847
15 25679 15661  2942
16 1055 2191  2119
17 5437 6461  734
18 1029 1183  2302
19 23710 12222  2598
20 1091 2343  2654
print df.drop(df.columns[[1, 2]], axis = 1).head()

# OUTPUT
 Abra Ifugao Kalinga
0 1243 3300 10553
1 4158 8063 35257
2 1787 1074  4544
3 17152 19607 31687
4 1266 3315  8520
print df.describe()

# OUTPUT
    Abra  Apayao  Benguet  Ifugao  Kalinga
count  79.000000  79.000000 79.000000  79.000000  79.000000
mean 12874.379747 16860.645570 3237.392405 12414.620253 30446.417722
std 16746.466945 15448.153794 1588.536429 5034.282019 22245.707692
min  927.000000 401.000000 148.000000 1074.000000 2346.000000
25%  1524.000000 3435.500000 2328.000000 8205.000000 8601.500000
50%  5790.000000 10588.000000 3202.000000 13044.000000 24494.000000
75% 13330.500000 33289.000000 3918.500000 16099.500000 52510.500000
max 60303.000000 54625.000000 8813.000000 21031.000000 68663.000000from scipy import stats as ss # Perform one sample t-test using 1500 as the true mean print ss.ttest_1samp(a = df.ix[:, 'Abra'], popmean = 15000) # OUTPUT (-1.1281738488299586, 0.26270472069109496)
t 통계
prob : 부동 소수점 또는 배열 유형
양측 p-값 양측 확률 값
print ss.ttest_1samp(a = df, popmean = 15000)

# OUTPUT
(array([ -1.12817385, 1.07053437, -65.81425599, -4.564575 , 6.17156198]),
 array([ 2.62704721e-01, 2.87680340e-01, 4.15643528e-70,
   1.83764399e-05, 2.82461897e-08]))
시각화
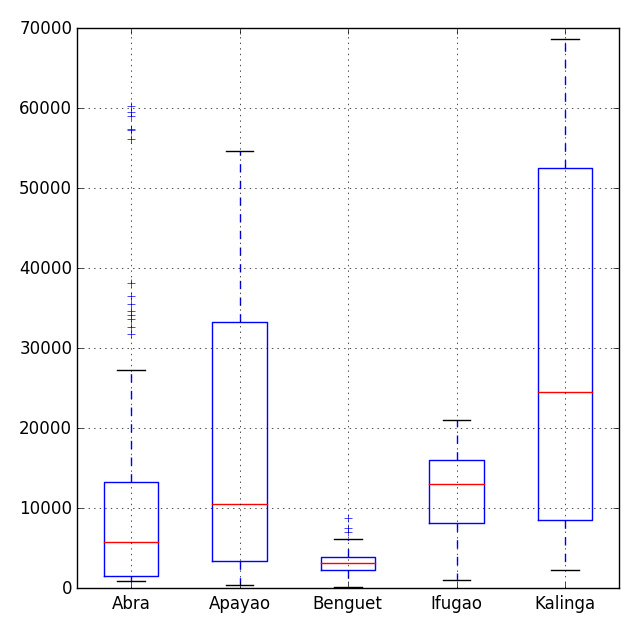
# Import the module for plotting
import matplotlib.pyplot as plt
 plt.show(df.plot(kind = 'box'))
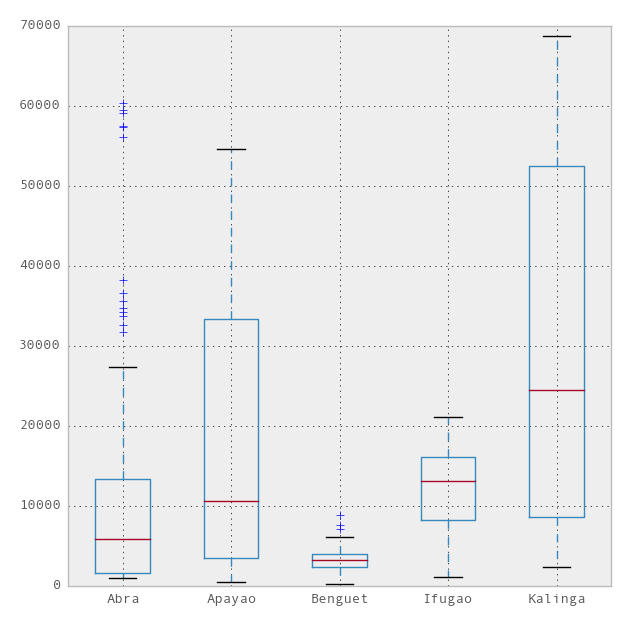
import matplotlib.pyplot as plt
pd.options.display.mpl_style = 'default' # Sets the plotting display theme to ggplot2
df.plot(kind = 'box')
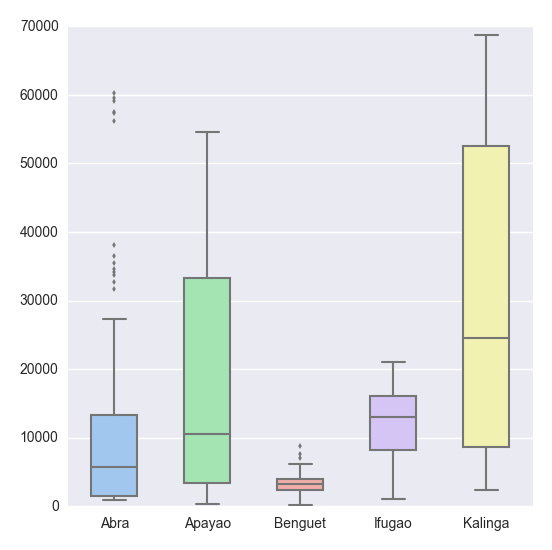
# Import the seaborn library
import seaborn as sns
 # Do the boxplot
plt.show(sns.boxplot(df, widths = 0.5, color = "pastel"))
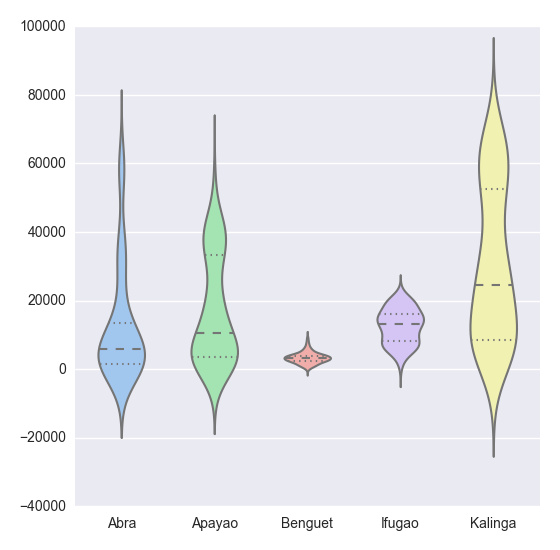
plt.show(sns.violinplot(df, widths = 0.5, color = "pastel"))
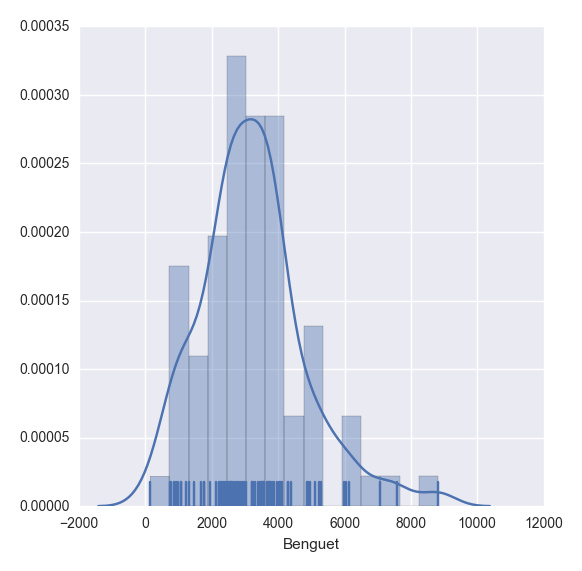
plt.show(sns.distplot(df.ix[:,2], rug = True, bins = 15))
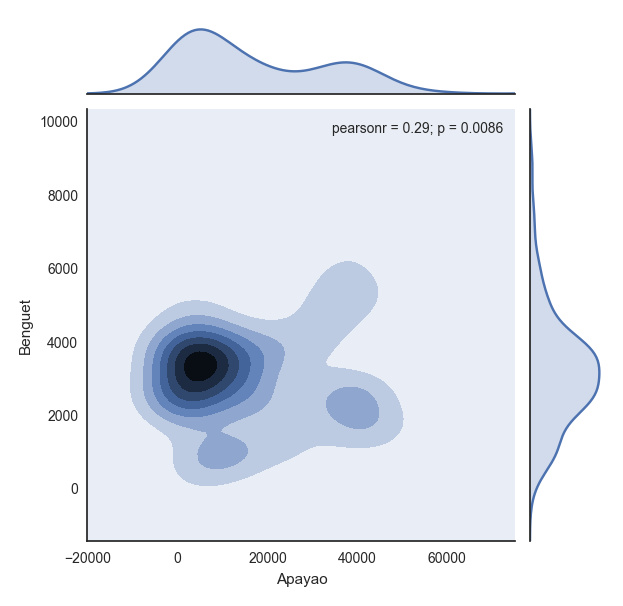
with sns.axes_style("white"):
 plt.show(sns.jointplot(df.ix[:,1], df.ix[:,2], kind = "kde"))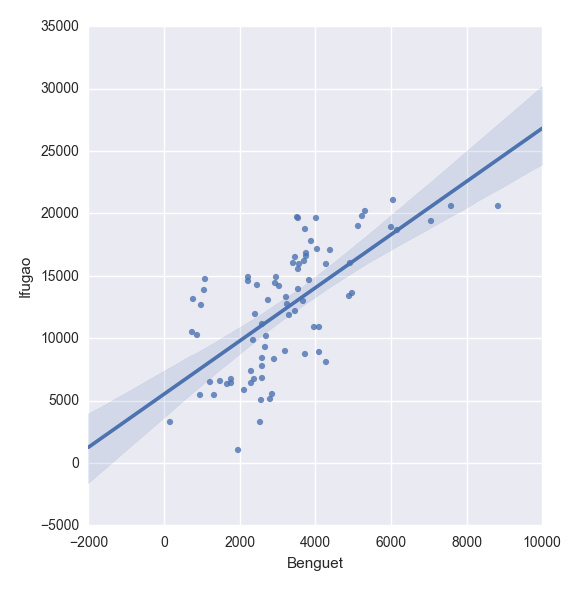
plt.show(sns.lmplot("Benguet", "Ifugao", df))创建自定义函数
在Python中,我们使用def函数来实现一个自定义函数。例如,如果我们要定义一个两数相加的函数,如下即可:
def add_2int(x, y):
 return x + y

print add_2int(2, 2)

# OUTPUT
4
顺便说一下,Python中的缩进是很重要的。通过缩进来定义函数作用域,就像在R语言中使用大括号{…}一样。这有一个我们之前博文的例子:
产生10个正态分布样本,其中u=3和o.
基于95%的置信度,计算 x_bar 和 x_bar2 ;
重复100次; 然后
计算出置信区间包含真实均值的百分比
Python中,程序如下:
import numpy as np
import scipy.stats as ss

def case(n = 10, mu = 3, sigma = np.sqrt(5), p = 0.025, rep = 100):
 m = np.zeros((rep, 4))

 for i in range(rep):
  norm = np.random.normal(loc = mu, scale = sigma, size = n)
  xbar = np.mean(norm)
  low = xbar - ss.norm.ppf(q = 1 - p) * (sigma / np.sqrt(n))
  up = xbar + ss.norm.ppf(q = 1 - p) * (sigma / np.sqrt(n))

  if (mu > low) & (mu < up):
   rem = 1
  else:
   rem = 0

  m[i, :] = [xbar, low, up, rem]

 inside = np.sum(m[:, 3])
 per = inside / rep
 desc = "There are " + str(inside) + " confidence intervals that contain "
   "the true mean (" + str(mu) + "), that is " + str(per) + " percent of the total CIs"

 return {"Matrix": m, "Decision": desc}
上述代码读起来很简单,但是循环的时候就很慢了。下面针对上述代码进行了改进,这多亏了 Python专家。
import numpy as np
import scipy.stats as ss

def case2(n = 10, mu = 3, sigma = np.sqrt(5), p = 0.025, rep = 100):
 scaled_crit = ss.norm.ppf(q = 1 - p) * (sigma / np.sqrt(n))
 norm = np.random.normal(loc = mu, scale = sigma, size = (rep, n))

 xbar = norm.mean(1)
 low = xbar - scaled_crit
 up = xbar + scaled_crit

 rem = (mu > low) & (mu < up)
 m = np.c_[xbar, low, up, rem]

 inside = np.sum(m[:, 3])
 per = inside / rep
 desc = "There are " + str(inside) + " confidence intervals that contain "
   "the true mean (" + str(mu) + "), that is " + str(per) + " percent of the total CIs"
return {"Matrix": m, "Decision": desc}更多데이터 분석을 위해 Python을 사용하는 방법에 대한 간단한 튜토리얼相关文章请关注PHP中文网!